AUTOMATED TRADING

AUTOMATED TRADING

9 March 2012

NIFTY X-RAY REPORT FOR 11 MARCH

NIFTY X-RAY REPORT FOR 11 MARCH
NIFTY closed at 5333.55+2.17%
5200PE OI  ADDED 650750 CONTRACTS TOTAL 7474700
5300 PE OI ADDED 1290350 CONTRACTS TOTAL 6164250
5400 PE OI ADDED 206150 CONTRACTS TOTAL 3482150
5300CE OI DECREASED -331650 CONTRACTS TOTAL 3519450
5400CE OI DECREASED -6200 CONTRACTS TOTAL 4326000
5500CE OI DECREASED -137100 CONTRACTS TOTAL 4974700
===========================================================
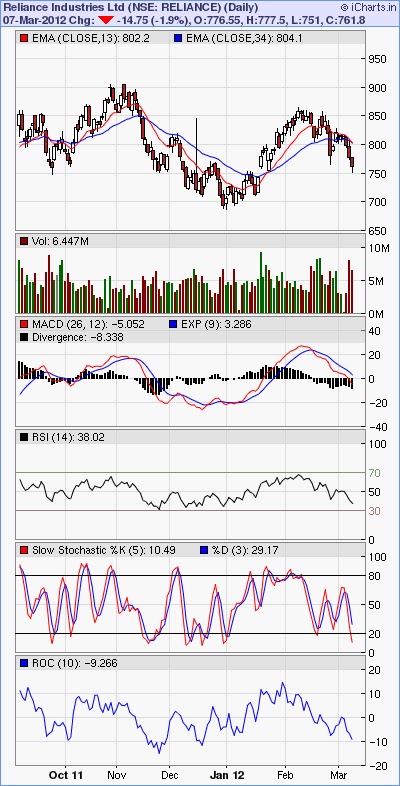
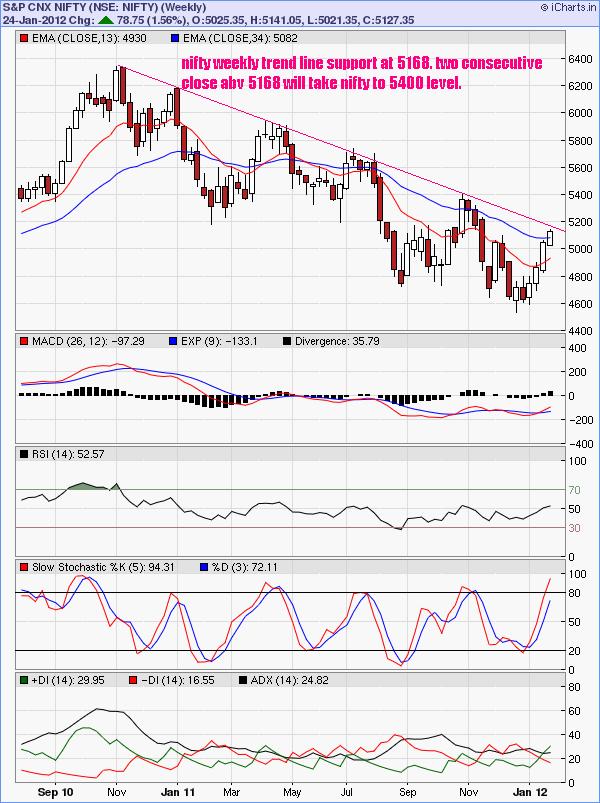
As per option OI data huge open interest addition seen in 5300 PE. and we have seen in deduction in 5200,5300, 5400 and 5500 CE, indicating clearly that PUTS have been written today. As I have all ready given indication on wednessday that market may reverse. Idont know howmany of you believed or not. It has given smart recovery from 5200DMA. Rate cuts by 75BPS to 4.75% from 5.5% by RBI can boost up this rally on monday, and any closing above 5440 we may kiss once again 5600 level very soon. A smell of cooking by RBI from special source had come during trading our today. I have all ready given recomendation today to my all paid subscribers to buy nifty as much as you can . outside bar bullish candal has perform on daily charts. As I told you yesterday as per fast and slow stochastic nifty was in oversold zone.Today RSI and STOCHASTIC has turned up, indicating a strong upmove. nifty has given closing at just above 13EMA. Watch the sustaining move above 5400 on monday. if sustain we may see a smart rally. Banking, finance, reallty, auto will boost niftyup.
FII has bought 1284.65cr today in cash market.
=================================================================================
                                    HIGH                  LOW              CLOSE
LAST                          5342                     5291                5333.55
PREV                         5243.85                5171.45           5220.45
LWEEK                     5458.80                5268.15           5359.35
===========================================================
SWING INDICATOR
   5D  SELL @ 5429 REVERSAL 5393
10D SELL @ 5281 REVERSAL 5521
20D SELL @ 5222 REVERSAL 5630
================================================
INTRADAY SUPPORT AND RESISTANCE
S2-5271/S1-5302/PIVOT-5322.45/R1-5353/R2-5373
=================================================
MOVING AVRAGES
5D-5359/10D-5429/20D-5607
HIGEST CLOSE
5D-5359/10D-5429/20D-5607
LOWEST CLOSE
5D-5220/10D-5220/20D-5220

8 March 2012

NIFTY X- RAY REPORT FOR 09 MARCH

NIFTY X-RAY REPORT FOR 09 MARCH
Nifty closed at 5220.45(-0.04%)
Advance/Decline==378/728
5200 CE OI ADDED 526150 CONTRACTS TOTAL 3316350
5300 CE OI ADDED 890600 CONTRACTS TOTAL 4032350
5200 PE OI ADDED 45600 CONTRACTS   TOTAL 7584850
5300 PE OI SHADED -211350 CONTRACTS TOTAL 5414400
=======================================================
Nifty has given lowest close after 12 trading session.5169 which is 200 DMA acted as a strong support zone, and we saw  strong recovery from that level. As per fast and slow stochastic nifty was in oversold zone. 5300CE added higest open interest on call side, even 5200CE seen writting yesterday. but higest open interest in 5200 pe not let the nifty fall too much. It took support at 200 DMA and recovered almost 55 points from that level. FII sold 28305 contract in nifty future  worth 742 crores and open interest decreasingby 18059 contracts indicating profit booking on short side on wednesday. I have alerted you on wednesday during trading hour that nifty may take reverse from 5150 level. Nifty is tecnically sell mode. All world indices supporting nifty to recover from 200 DMA. Untill unless nifty given close above 5420 it will not come in strong buy mode. any close above 5420 this time nifty may touch its previous high.
                            HIGH        LOW          CLOSE
LAST                  5243.85      5171.45       5220.45
PREV                 5382.05      5206.40        5222.40
L.WEEK            5458.80      5265.15        5359.35
==================================================================
SWING INDICATORES
5D-  SELL @ 5429 REVERSAL 5393
10D-SELL @5281 REVERSAL 5537
20D-SELL @ 5222 REVERSAL 5630
==================================================================
As per Relative Strength Indicator (RSI), Cipla Ltd. is in over sold level. However, recent price moves on 07/03/2012 indicates trend reversal and stock may rise in near future.This was done with jump in volume. Which is another indicator supporting the counter trend. This stock is in short term down trend. A Bullish harami Candlestick pattern was formed by Cipla Ltd. on 07/03/2012 with rise in volume. Prior to pattern formation this share was in downtrend. Share has hit three months low on 07/03/2012
As per slow stochastic  and rsi stock is in over sold range. traders may book frofit from long side and reverse trade.Buy this stock for the target of 325 and keep stoploss at 302.

HCL TECHNOLOGIES.LTD.

A Bullish engulfing Candlestick pattern has formed by HCL Technologies Ltd. on 07/03/2012 with rise in volume. Stock has jumped by more than 25% in last three Month.. Share has hit two week high on 07/03/2012
As per RSI , HCL Technologies Ltd. is in STRONG BUY ZONE territory with a value of 70.0318. buy this stock at current price level for the target of 520-525. keep a stoploss at 482.

ITC

Doji Candlestick pattern has formed by I T C Ltd. on 07/03/2012 and Bearish harami Candlestick pattern has formed by I T C Ltd. on 07/03/2012. I T C Ltd. has moved below 15 days Simple Moving Average after 11 days on 02/03/2012
Stock - I T C Ltd. has moved below 20 days Exponential Moving Average after 10 days on 02/03/2012
As per Rsi Indicator , I T C Ltd. has given negetive divergence on eod charts. However, recent price moves on 01/03/2012 indicates trend reversal and stock may more fall / correct in near future. Short this stocks below 206 target 195-190. stoploss 212.


RELIANCE VIEWS

Few days back i told you, short reliance at 800 and we gave target of 875. Reliance Industries Ltd. has broken down support of 875, as defined by Bollinger bands, with good volume on 07/03/2012. This could mean a down move is imminent. This stock is in short term down trend.
Share has hit one month low on 07/03/2012. Short traders book profit and reverse your tarde.
As per fast and slow stochastic, Reliance Industries Ltd. is in over sold range with a value of 10.1504. Reliance Industries Ltd. share price is down along with rise in volume on 06/03/2012 . This signals a downward trend. But it has recoverd from 750 level which is strong support zone. momentum traders may buy Reliance at 760 target 800.

6 March 2012

NIFTY X-RAY REPORT FOR 07 MARCH

NIFTY X-RAY REPORT FOR 07 MARCH
NIFTY CLOSED AT 5222.40  -1.10%
5000CE OI ADDED 10100 CONTRACTS TOTAL OI -1362300
5100CE OI ADDED 174650 CONTRACTS TOTAL OI-1089300
5200CE OI ADDED 314450 CONTRACTS TOTAL OI-2744700
5300CE OI ADDED 426400 CONTRACTS TOTAL OI- 3189350
5000PE OI ADDED 1373100 CONTRACTS TOTAL OI -6448650
5100PE OI ADDED 321800 CONTRACTS TOTAL OI-5088550
5200PE OI ADDED -59600 CONTRACTS TOTAL OI-7927450
5300PE OI ADDED 6188700 CONTRACTS TOTAL OI- 288100
============================================================
AS I TOLD YOU YESTERDAY, TODAY WOULD BE A VERY VOLATILE DAY AND I TOLD YOU ALSO THAT ACCORDING TO OI DATA TRADING RANGE WILL BE BETWEEN 5200-5300. I TOLD YOU ALSO THAT ANY BREAK OF 5300 LEVEL NIFTY MAY DRAG MINIMUM 200 POINTS EITHER SIDE.TODAY ALL PICTURE HAS BEEN CHANGED. HIGEST OPEN INTEREST SEEN IN 5200 CE AND HIGEST OPEN INTEREST SEEN IN 5000PE. CLEARLY INDICATING  NIFTY MAY FALL UPTO 5060-5080 LEVEL IN COMING DAYS. ALL SHORT TRADERS CAN BOOK PROFIT IN NIFTY AT THAT LEVEL. AND A SHARP BOUNCE BACK IS EXPECTED FROM THAT LEVEL. ANY BAD GLOBAL TREND MAY NIFTY DRAG TO THIS LEVEL.
====================================================================================
FII/DII TURNOVER
FII -241.22/ DII+179.91
ADVANCE/DECLINE======314/789
                                 HIGH                     LOW                     CLOSE
LAST                       5382                        5206                       5222
PREV                      5344                        5265                       5280
L.WEEK                 5458                        5268                       5359
===================================================================
SWING INDICATOR
5D- DOWN 5222  REVERSAL  5459
10D-DOWN 5281 REVERSAL   5630
20D- DOWN 5222 REVERSAL  5630
====================================================================
INTRADAY SUPPORT AND RESISTANCE
S2-5094/S1-5158/ PIVOT-5270/R1-5334/R2-5445
=====================================================================
MOVING AVRAGES
5D-5317/20D-5410/50D-5128/200D-5170
HIGEST CLOSE
5D-5385/10D-5505/20D-5607
LOWEST CLOSE
5D-5222/10D-5222/20D-5222

5 March 2012

NIFTY X-RAY REPORT FOR 06 MARCH

NIFTY X-RAY REPORT FOR 06 MARCH
NIFTY CLOSED AT 5280.35(-1.47%)
5200 PE OI ADDED 996150 CONTRACT TOTAL OI-8424350
5300 PE OI ADDED 348750 CONTRACT TOTAL OI-2849500
5400PE OI ADDED 175650 CONTRACT TOTAL OI-3850000
======================================================
5200 CE OI ADDED 381950 CONTRACT TOTAL OI -2471400
5300 CE OI ADDED 8071700 CONTRACT TOTAL OI -2849500
5400 CE OI ADDED 488900 CONTRACT TOTAL OI-3683400
ADVANCE/DECLINE=====370/742
AS I told you earlier that market is playing see saw between 5300 -5400. I told you also there is minimum 200 points rally is confirm after breaking 5300 or 5400. today higest open interest addition seen in 5300 call and 5200 put. indicating next trading range between 5200 to 5300. but due to election result tomorrow we expect highly volatile trading session either side. Any significant event on the international front could also have an impact on the markets. best stratagy in current time is wait and watch. On the other hand, risky takers can adopt the ‘straddle option’ strategy, which will benefit them if the markets swing in either side. As per option open interest data Nifty will face  first support  at 5210 and the second one is at 5150. On the other side, the first resistance is at 5440 and the second is at 5610.
                          HIGH              LOW           CLOSE
LAST                5344.50            5265.70         5280.35
PREV               5392.55            5315               5359
LWEEK           5458.80            5265               5359
====================================================
SWING INDICATORS
5D- DOWN    5429   REVERSAL        5459
10D- DOWN   5281  REVERSAL        5630
20D-UP           4850   REVERSAL        5266
====================================================
INTRADAY SUPPORT AND RESISTANCE
S2-5218/S1-5249/PIVOT-5296/R1-5328/R2-5375
====================================================
MOVING AVRAGES
5D-5349/20D-5417/50D-5118/200D-5172
HIGEST CLOSE
5D-5385/10D-5607/20D-5607
LOWEST CLOSE
5D-5280/10D-5280/20D-5280

2 March 2012

RELIANCE VIEWS

NO TRADING ZONE BETWEEN 800-821. THERE IS A BIG TRADING OPPORTUNITY BELOW 800 TARGET 775 STOPLOSS 820 OR BUY ABOVE 821 TARGET 860 STOPLOSS 800 SPOT PRICE. TILL THAN WATCH CAREFULLY.

1 March 2012

NIFTY X-RAY REPORT FOR 02 MARCH
NIFTY CLOSED AT 5339.75= -0.90%
NIFTY FUTURE CLOSED AT 5390.75 -0.90% OI DN 1.76%
ADVANCE/DECLINE                    408/693
======================================================
NIFTY 5200CE OI ADDED 73150 TOTAL = 2130950
NIFTY 5300CE OI ADDED 408400 TOTAL = 2080000
NIFTY 5400CE OI ADDED 760900 TOTAL = 3231500
NIFTY 5200PE OI REDUCED -65300 TOTAL=7521600
NIFTY 5300PE OI ADDED 369000 TOTAL= 6578200
NIFTY 5400PE OI ADDED 158850 TOTAL=4017100
======================================================
I TOLD YOU YESTERDAY UNTILL UNLESS NIFTY CLOSED ABOVE 5440 BULL CANNOT BE COME IN POWER. I ALSO TOLD EXPECT VOLATILITY. ACCORDING TO OI DATA THE PICTURE HAS CHANGE TODAY.5400 AND 5300CE ADDED HUGE OPEN INTEREST . CALL WRITTERS WERE AGGRESIVE TODAY. 5300 PUT ALSO ADDED HUGE OI. INDICATING VOLATILITY AROUND 5300 LEVEL FOR SOME MORE DAYS.BUT ANY  SINGLE CLOSE BELOW 5300 NIFTY THIS TIME DRAG TO 5150 LEVEL VERY SOON. AFTER TWO MONTH FII FIGURE WAS SEEN IN SELL TODAY . THEY SOLD 126.52 CRORE TODAY. YESTERDAY FII SOLD MORE THAN 6000 CONTRACT I NIFTY FUTURE. WEEKLY CHART TREND LINE SUPPORT IS COMING AT AROUND 5100 LEVEL. ANY ONE SIDED POSSITION MAY BE RISKY. EXPECT VOLATILITY TILL NEXT ONE MORE WEEK.
                                   HIGH            LOW             CLOSE
LAST                         5372               5297                5339
PREV                        5458               5352                 5385
L WEEK                   5629               5405                 5429
==================================================
SWING INDICATION
5DAYS    ----SELL   5429           REVERSAL---5521
10DAYS------ SELL  5281           REVERSAL---5630
20DAYS------ BUY   4850            REVERSAL ---5226
===================================================
INTRADAY SUPPORT AND RESISTANCE
S2-5261/ S1-5300/PIVOT-5336/R1-5375/R2-5411
====================================================
HIGEST CLOSE 5D-5429/10D-5607/20D-5607
LOWEST CLOSE-5D-5281/10D-5281/20D-5269
====================================================
NIFTY FUTURE MOVING AVRAGES
5DAYS-  5411 SELL
10DAYS-5503 SELL
20DAYS-5462 SELL
50DAYS- 5139 -BUY
100DAYS-5068 BUY
200 DAYS- 5164 BUY
======================================================
BEARS WERE WAITING FOR FIGHT WITH BULLS AT THE 5440 LEVEL. ANY CLOSE BELOW 5300 THIS TIME NIFTY MAY DRAG TO 5100-5050 VERY SOON. NIFTY ON WEEKLY CHARTS TREND LINE SUPPORT AT 5100 LEVEL. YESTERDAY SHORT SEEN IN NIFTY FUTURE BY FII. SHORT NIFTY FOR THE TARGET OF 5100.

29 February 2012

NIFTY X-RAY REPORT FOR 01 MARCH

NIFTY CLOSED AT 5385.20
NIFTY FUTURE CLOSED AT 5439.50 -OI UP 2.13%
ADVANCE/DECLINE       658/451
5300 CE OI ADDED = 2350 TOTAL =1674900
5400 CE OI ADDED = 205600 TOTAL =2494300
5500 CE OI ADDED =64350 TOTAL =3927750
5200 PE OI ADDED= 378000 TOTAL =7689700
5300PE OI ADDED = 471850 TOTAL= 6310050
5400 PE OI ADDED= 47350 TOTAL =3951400
HIGEST OPEN INTEREST ADDITION SEEN IN 5400 PUT AND 5500 CALL INDICATING FOR NEXT DAY TRADING RANGE  BETWEEN 5400-5500. OPEN INTEREST IS SHOWING FURTHER 5300 AND 5200 IS STRONG SUPPORT. AS I TOLD YOU YESTERDAY UNTILL UNLESS NIFTY CLOSE ABOVE 5440 BULLS WILL NOT COME IN POWER. TODAY NIFTY WENT ABOVE 5440 BUT GDP DATA DRAG NIFTY ALL ITS RISE. EXPECT SOME MORE DAY VOLATILE SESSION.
                    HIGH                  LOW               CLOSE
LAST          5458                     5352                 5385
PREV         5391                     5306                 5378
L WEEK    5629                     5405                 5429
=============================================
SWING INDICATOR
 5DAY        DOWN        5429  REVERSAL   5537
10DAY       DOWN        5630  REVERSAL   5630
20DAY       UP                4850  REVERSAL   5159
==============================================
INTRADAY SUPPORT AND RESISTANCE
S2-5392/S1-5338/PIVOT-5398/R1-5445/R2-5505
==============================================
MOVING AVRAGES
5D-5392/20D-5409/50D-5077/200D-5175
HIGEST CLOSE
5D-5483/10D-5607/20D-5607
LOWEST CLOSE
5D-5281/10D-5281/20D-5235 
 BOOK PROFIT IN NIFTY 5500 CALL AT 140 BUY CALL GIVEN AT 111 YESTERDAY.

28 February 2012

NIFTY X-RAY REPORT FOR 29 FEB
Nifty closed at 5375.50 +94.30 1.79%
Nifty future closed at 5441 + 1.93% open interest up by 2.69%
nifty 5200CE oi reduced -7700 shares total oi 2035950./5300 CE oi added 87050 total oi 1675300 . 5400 CE added 56500 total 2309100. / 5500CE oi added 274950 total 3988550.
5200PE added 1039850 total 7367000./ 5300 PE oi added 230300 total 662044./ 5400PE oi added 450600 total 3905950./ 5500PE oi added 191400 total 3042950.
We have covered almost our losses today what we have done3 yesterday. If we consider carefully on oi data we will find a interesting story is that put writers are more confident than call writters. put open interest is almost double and in some strick price are more than triple. all that data is indicating clearly that bull has more power. BUt nifty spot untill unless close above 5440 the bull rally will not be confirmed. we expect volatility till budget.
India vix-25.85-1.53-5.59%
advance /decline  =956/153
                      HIGH               LOW            CLOSE
LAST            5391.10             5306.45       5378.85
PREV           5449.80             5268.15       5281.20
LASTWEEK5629.95           5405.90          5429.30
SWING INDICATOR
5D   DN       5429      REVERSAL      5630
10D   DN   5281        REVERSAL      5630
20D   UP      4850      REVERSAL     5120
INTRADAY SUPPORT AND RESISTANCE
S2-5274/ S1-5326 / PIVOT 5358.80/ R1- 5411/R2 5443
HIGEST HIGH AND LOWEST CLOSE
5D-5505/5281.20
10D-5607/5281.20
20D-5607/5199
MOVING AVRAGES SIMPLE
5D-5416/ 20D-5400/ 50D-5062/200D-5175      
 BUY NIFTY 5500 CALL AT 111 STOP LOSS 91 TARGET 150

27 February 2012

NIFTY X-RAY REPORT FOR 28 FEB

NIFTY x-RAY REPORT FOR 28 FEB
NIFTY CLOSED AT 5281 AND NIFTY FUTURE CLOSED AT 5338.60 -2.71% OPEN INTEREST 248.27LAKH.
5100 CE OI ADDED 43650 =629100 /PUT  ADDED 293400 =3829500
5200 CE OI ADDED 265700=2023550/ PUT ADDED 1513450 =6297500
5300 CE OI ADDED 364050= 1584950/ PUT ADDED 1035800 =6431350
5400CE OI ADDED 693100=2413750/ PUT REDUCED -168950= 3653200

STILL PUT WRITERS ARE GREATER THAN CALL WRITERS. THERE ARE VERY LEAST OPEN INTEREST IN CALL SIDE. PUT WRITERS ARE MORE CONFIDENT AT EVERY LEVEL THEY ARE SAYING COME AND BUY BELOW THAT LEVEL ALL IS YOURS. NIFTY FUTURE   TRADING AT 57 POINT PREMIUM. NIFTY OPEN INTEREST REDUCED BY 2.21%. FII BUY TODAY 329.09 CR.
NIFTY  HAS BROKEN ITS PSYCHOLOGICAL SUPPORT LEVEL OF 5330. NOTED THIS WORD PSYCHOLOGICAL. 5330 THAT WAS NO A TECHNICAL LEVEL. TECHNICALLY NIFTY SHOULD TAKE SUPPORT AT 5257 LEVEL AND THAN 5176 WHICH IS 200 DAY SIMPLE MOVING AVRAGE. IF BREACH THEASE LEVEL NIFTY MAY CORRECT HEAVILY. TODAYS VOLLUM WAS VERY LOW SO FALL SHOULD CONSIDER AS A CORRECTION OF BULL RUN ONLY.
MOST OF TRADE WOULD BE TRIGGERED STOPLOSS AT 5330 LEVEL. AND WHATEVER YOU HAVE EARNED IN MORNING SESSION YOU WOULD HAVE LOST IT IN NOON SESSION. BUY I WAS JUST WATCHING  THE FALL AND NOT GIVEN ANY LONG CALL IN NIFTY.
                      HIGH           LOW            CLOSE
LAST            5449.80         5268.15         5281.20
PREV           5521.40         5405.90         5429
LAST WEEK5629.95       4505.90           5429.30
SWING TREND
5D     DOWN          5429    REVERSAL    5630
10D   DOWN          5281    REVERSAL    5630
20D    UP                 4850    REVERSAL    5077
ADVANCE/ DECLINE  
126              /   970
INTRADAY SUPPORT AND RESISTANCE LEVEL
S2-5151/S1-5216/ PIVOT-5330/ R1- 5397/-R2-5514
WEEKLY SUPPORT AND RESISTANCE
S2-5264/S1-5346/PIVOT-5488/R1-5570/R2-5712
MOVING AVRAGE
5D-5601/20D-5385/50D-5047/200D-5176
FII/DII TURNOVER (BSE+NSE)
FII+329.09/ DII-699.14.
BOOK PROFIT IN NIFTY 5400 PUT AT 142 BUY CALL GIVEN AT 109 LEVEL ON 23 FEB

26 February 2012

                                                           click on chart for larger views.

25 February 2012

NIFTY X-RAY REPORT FOR 27/02/12
NIFTY CLOSED AT 5429.30.  NIFTY FUTURE CLOSED AT 5487.30 PREMIUM UP BY MORE THAN 1%. NIFTY FUTURE OPEN INTEREST UP BY 107.24%. ALMOST 1% PREMIUM IN NIFTY FUTURE WE SEE IN NEXT SEREIS. BUT 1% PREMIUM IN THIS SEREIS AND OI ADDITION OF107.24% IN NIFTY FUTURE IS INDICATING SOMTHING.
WHAT IS INDICATING  LETS CONSIDER OPTION OI DATA.
5300 CE -60550 TOTAL= 1220900// 5300PE+ 833600=5395550
5400CE +74700 TOTAL=1720650// 5400PE+293800 =3822150
5500CE+425350 TOTAL=3027300// 5500PE+83800=3016750
5600CE+ 264750 TOTAL=2810200
WE CLEARLY SEE THAT OPEN INTEREST IN PUT SIDE IS ALMOST DOUBLE THAN CALL SIDE IN 5300 AND 5400. NIFTY FUTURE PREMIUM AND 107.24% ADDITION IN NIFTY FUTURE IS INDICATING A BIG MOVE IS GOING TO HAPPEN. ACCORDING TO  OPTION OI DATA WE FIND THAT PUT WRITERS ARE MORE CONFIDENT THAN CALL WRITERS. SO THESE ALL DRAMA IS INDICATING A BIG UP MOVE. BUT FROM WHERE IT WILL MOVE ? WE NEED TO BE ALERT AROUND 5400 LEVELS.
NIFTY AROUND 5400-5330 LEVEL FACE STRONG SUPPORT. ANY REVERSAL FROM THESE LEVELS AND CLOSING ABOVE 5500 SPOT WILL CONFIRM THE MOVE.
NIFTY                         HIGH                   LOW                       CLOSE
LAST                            5521                   5405                          5429
WEEK LAST            5606.70                 5357.40                    5564.30 
INDIA VIX -24.82
INTRADAY SUPPORT FOR NEXT DAY
S2-5383/S1-5336.20/PIVOT-5452/R1-5498/R2-5567
SIMPLE MOVING AVRAGE
5D-5518 / 20D-5382 / 50D-5037/ 200D-5178
5DAYS HIGEST CLOSE-5607.15 /LOWEST CLOSE --5429.30
20 DAYS HIGEST CLOSE 5607.15 / LOWEST CLOSE-5087.30
SWING TREND INDICATOR
5 DAYS -DOWN- EFFECTIVE PRICE AT 5429 REVERSAL 5630
10 DAYS-UP EFFECTIVE PRICE AT 4850 REVERSAL 5341
 20 DAYS -UP EFFECTIVE PRICE  AT 4850 REVERSAL 5077

24 February 2012

 WHY ARE YOU LOOSING MONEY FREQUENTLY. THAT MEANS YOU WILL HAVE TO CHANGE SOMETHING. QUESTION IS WHAT YOU WILL CHANGE. THERE ARE LOTS OF DIFFERENCE BETWEEN TRADING PSYCHOLOGY AND HUMAN PSYCHOLOGY. IF YOU ARE NOT DEVELOPING YOUR  TRADING PSYCHOLOGY WELL YOU HAVE A BEST OPTION THAT YOU SUBSCRIBE FROM GOOD PLACE.
OUR SUBSCRIBERS ARE MAKING DOUBLE MONEY EVERY MONTHS. WHAT ARE YOU WAITING FOR. JUST HAVE A TRAIL FOR A MONTH.
SUBSCRIBE WITH US NOW A NEW BATCH IS STARTING FROM 01 MARCH. CONFIRM YOUR SEAT BEFORE IT FULL.
OUR  FNO FEB 2012 SERIES PERFORMANCE
DATE    STRICK               QNTY    BUY PRICE   EXIT PRICE    PROFIT            LOSS
24/01    5200CE                 100        97                       150                   5300
27/01    5200PE                  50          97                       127                   1500
29/01   2750 CE INFY       125        47                        65                    2250
31/01    5200CE                 100        95                       150                    5500
06/02    440HULCE                  1000       02                         00                             2000
07/02    5400PE                 50          96                        129                   1650
14/02    5500CE                100        33                         117                   8400
14/02    5400PE                  50         57                        00                                      2850
16/02    2400CESBI          125        24                         84                     7500
__________________________________________________________________________
TOTAL                                                                                               32100         4850
NET INCOME = PROFIT- LOSS =32100-4850=27250 
we have invested money in market at a time not more than 12000
very good place for small investors who want to earn money.

23 February 2012

NIFTY ULTIMATELY FELL FROM 5625. THIS IS THE BIGGEST FALL IN LAST TWO MONTHS. IT WAS ONLY OVERBOUGHT REASON IN BULLRUN. BUT THIS IS NOT THE TIME TO BE PANIC.
5600 CALL MARCH ADDED HIGHEST 696300 OPEN INTEREST TODAY.5300 PUT MARCH 692100 SHARES IN OPEN INTEREST. THIS DATA IS INDICATING THAT THERE IS NO FALL BELLOW 5300 FURTHER. FII  BUY FIGURE IS VERY SURPRISINGLY TODAY. THEY HAVE BOUGHT ALMOST 800 CRORE IN CASH MARKET. WELL  THE QUESTION IS WHO SOLD IN MARKET.
INNOCENT  TRADER SOLD 1300 CRORE IN HARASSMENT AND FEAR. BUY ON DIPS AROUND 5377 LEVEL IS ADVISABLE. NIFTY WILL FACE IMMEDIATE SUPPORT AT 5461 - 5424 LEVEL AFTER BREAKING 5424 NIFTY MAY SLIP TO 5325 LEVEL.
NOW SUPPOSE IF BREAK ANY HOW 5300 LEVEL WE MAY SEE A NEW LOW. BUT ITS CHANCES ARE VERY VERY LOW AT PRESENT LEVEL. IF MARKET WOULD HAVE FALL WELL WHY FII MONEY WOULD BE INVESTED IN MARKET. RETURNING FROM 5377 OR 5440  PROBABILITY IS HIGH.
ACCORDING TO SWING TECHNIC NIFTY IS IN SELL MODE ON 3 DAY EMA.
UNTIL UNLESS BULL HOLD LEVEL ABOVE 200 DMA NO PROBLEM FOR BULLS.

22 February 2012

 NIFTY VIEWS  FOR 22/02/12
BE EVERY BODY ON DANCE FLOOR TILL  BULL DISCO MUSIC LAST. 5600 PUT ADDED 840400 CONTRACT IN OPEN INTEREST IN FEBRUARY SEREIS AND ADDED 202000 SHARES IN OPEN INTEREST. INTERESTINGLY 5600 CALL REDUCED  677250 SHARES FROM ITS OPEN INTEREST, EVEN 5700 PUT WRITTING HAS BEEN SEEN TODAY. NIFTY FUTURE  UP BY 32 POINTS AND OPEN INTEREST HAS INCREASED BY 41487 CONTRACTS TODAY. MEANS MORE LONGS WERE ADDED BY SMART AND BIG PLAYERS ON NET TO NET BASIS. OK LETS SEE WHAT HAPPEND TODAY.............
ROLLOVER HAVE STARTED AND 70 LAKH SHARES GOT ROLLOVERED TO MARCH SEREIS WITH THE ADDITION OF 13 LAKH NEW SHARES IN NIFTY FUTURES. IT WILL GIVE MORE POWER TO BULL CARRIED POSITION TO MARCH. TODAY WHEN NIFTY FUTURE MADE LOWOF 5614 IN NOON WHOLE 57 LAKH GOT ROLL OVERED AT THAT TIME. SO CONSIDER THAT 5614 LEVEL WILL WORK AS IMPORTANT SUPPORT FOR NIFTY FUTURE FOR MARCH SEREIS. BULLS ARE NOT GOING TO GIVE A CHANCE  OF EVEN 50 POINTS TO BEARS.
AS I TOLD YOU EARLIER ABOUT THE MARKET LEVEL YOU HAVE SEEN ALLREADY.
GOOD LUCK

21 February 2012

 NEW BATCH IS GOING TO START FROM 01 MARCH. LIMITED SEAT RESERVE YOUR SEAT BEFORE IT FULL.
 SUBSCRIBE OPTION SERVICES/ NIFTY FUTURE
HURRY LIMITED SEAT.
CONTACT FOR BANK DETAILS

20 February 2012

NIFTY HAS BEEN RISING SINCE JANUARY ONLY GAP UP. IT HAS GIVEN SMART MOVE OF ALMOST 1000 POINTS. MY FIRST TARGET 5600 HAS ALL READY ACHEAVED. NOW IT WILL KISS 5756 LEVEL TILL EXPIREY.
FII HAS BOUGHT ALMOST 2300 CRORE IN LAST TWO DAYS. BUYING MOMENTUM WILL CONTINUE FOR NEXT WEEK ALSO.
5600 PUT OPEN INTEREST ADDED 2765350 CONTRACTS AND 5600 CALL REDUCED 220250 CONTRACT. MEANS  NEW LONG POSITION HAS BEEN ADDED IN NIFTY FUTURE.
NIFTY WILL FACE RESISTANCE AT 5700-5756 LEVEL IN NEAR TERM.
A MINOR CORECTION IS EXPECTED FROM THAT LEVEL.

17 February 2012

 ALERT ALERT ALERT
IF MARKET DOES NOT FALL IN TEN DAYS(IN FEBRUARY) WE MAY SEE NIFTY NEW HIGH IN MARCH.6300 -6500
  WE BOOKED PROFIT FROM  NIFTY 5500 CALL AT 117. BUY RECOMMENDED AT 33.
RUPEES 8400 IN TWO LOTS.
PROFIT IS JUST MORE THAN  TRIPLE.
ENJOYYYYYYYYYYYYYYYYYYYYYYYYYYYY.
WHAT ELSE YOU WANT

WE HAVE DONE TRIPLE OUR INVESTMENT IN THIS MONTH.
MORE DETAILS TO OUR CLIENTS...........................................
 SBI 2400 CALL BOOKED PROFIT AT 90. RS 8250 IN JUST A DAY.
INVESTED AMOUNT RS 3000
PROFIT IS MORE THAN TRIPLE
WHAT ELSE YOU WANT.

SBI IS ON FIRE. WE GAVE A BUY CALL IN 2400 CALL YESTERDAY TO OUR PAID CLIENTS  AT 24 CURRENTLY TRADING AT 80. 
PROFITS ARE JUST MORE THAN TRIPLE IN JUST ONE TRADING SESSION .
ENJOY........................................................
JUST SEE WHY PEOPLE SUBSCRIBE WITH US,
TRADE TENSION FREE  AND ENJOY PROFITS.
SUBSCRIBE  OUR SERVICES

16 February 2012


NIFTY HAS GIVEN SMART MOVE AFTER CONSOLIDATING 7 DAYS. I TOLD YOU YESTERDAY THAT NIFTY HAS FOUND ITS NEXT DIRECTION TOWARDS UPSIDE. THOSE WHO HAVE NOT ENTER IN MARKET AND WAITING FOR A FALL, MARKET IS NOT GOING TO GIVE HIM CHANCE TO ENTER AT LOWER LEVEL.
AS YOU WOULD HAVE SEEN IN RAINY SEASON THAT MASROOM PLANTS ARE GROWN UP ALL AROUND, SIMILARLY NOW WHEN MARKET HAS MOVED UP 1000 POINTS FROM ITS 2011 LOW SO MANY ANALYST HAVE STARTED TALKING ABOUT NIFTY NEXT LEVEL. I HAVE ALERTED YOU EARLIER THAT MARKET IS GOING TOWARDS 5600 LEVEL.
NOW WHAT NEXT????????????????????
YESTERDAY WHERE 5400 PUT ADDED 1536300 SHARES IN OPEN INTEREST. MORE THAN DOUBLE OPEN INTEREST 3303450 SHARES ADDED TODAY IN 5500 PUT.AND 5500 CALL REDUCED 19994700 SHARES FROM ITS OPEN INTEREST. FII BOUGHT TODAY MORE THAN 1800 CR TODAY. EVEN WRITERS ARE GOING AWAY FROM 5600 LEVEL.
EXPECT A RALLY TILL 5756 IN THIS MOVE WITHIN A WEEK WHICH I TOLD YOU ALL READY ON 11 FEB. POSTED LINES ARE ABOVE SHOWN ALREADY.
SOMEBODY ARE STILL WAITING FOR A FALL  TO ENTER IN MARKET. I WOULD LIKE TO SUGGEST THEM MARKET IS NOT GOING TO GIVE THEM CHANCE.
TILL DECEMBER 2012 EXPECT NIFTY 9000 TO 10000 LEVEL.
SO MY DEAR FRIEND CONSIDER NOW MULTI YEAR BULL RUN.
WE MAY SEE A MINOR CORRECTION FOR  ONE OR TWO DAYS. BUT BULL HAS TO STAY ABOVE 5450 ANY HOW.

15 February 2012

 JUST SEE WHAT I TOLD FEW DAYS BACK THAT NIFTY IS GOING TOWARDS 5600 LEVEL.
NEXT HURDLE AT 5666 LEVEL. AFTER THAT NIFTY WILL KISS 5756 VERY SOON IN FEBRUARY. OUR CLIENTS HAVE MINTED MONEY.
WE HAVE DOUBLE OUR INVESTMENT ALL READY IN THIS MONTH.
NOW HOPE DOUBLE OF DOUBLES. 
 NIFTY HAS GIVEN STRONG UPSIDE BREAKOUT AFTER 7 DAYS  CONSOLIDATION. EXPECT NEAR TERM TARGET AROUND 5600 LEVEL.
HOLD ALL CALLS.

14 February 2012

BUY NIFTY 5500 CALL 2 LOT AT 33. NIFTY IS GIVING SIGNAL TO BREAK UP UPPER LEVEL. 5400 PUT WRITING HAS SEEN TODAY.
 MARKET IS STRUGGLING BETWEEN 5330 TO 5420 SINCE 6 DAYS. WAIT FOR CLEAR BREAKOUT. THERE IS MIN 150 POINTS EACH SIDE.

11 February 2012

                THERE IS MORE HOPE IN THIS BULL RUN. NIFTY IS SHOWING VERY FAST RECOVERY FROM EVERY FALL. FROM LAST FIVE DAYS IT IS TRADING BETWEEN 5323 TO 5423 LEVEL. NIFTY HAS SUSTAINED ABOVE 50 DMA ON WEEKLY CHARTS FROM MORE THAN 6 DAYS. IT IS FACING VERY CRUCIAL RESISTANCE NEAR 5400 LEVEL
                 NOW LETS CONSIDER THE OPTION DATA OF NIFTY. 5400 CALL OPEN INTEREST ADDED 402300 SHARES WITH TOTAL OPEN INTEREST OF 5741850. 5400 PUT OPEN INTEREST ADDED 515150 WITH TOTAL OI OF 4737950. 5300 PUT OPEN INTEREST ADDED 65900 SHARES WITH TOTAL OPEN INTEREST OF 6776150. 5300 CALL OPEN INTEREST  SHADED -238150 SHARES IN OPEN INTEREST.  CURRENTLY  VERY CRUCIAL AND CONFUSING DATA OF NIFTY.
                 INVESTORS NEED TO BE VERY CAUTIOUS AT THIS LEVEL.  ANY BAD NEWS DRAG NIFTY ANOTHER 100 POINTS FROM CURRENT LEVEL.
NOW SEE THE CHART BELLOW. CURRENTLY NIFTY STRUGGLING AROUND 5400 LEVEL ONE MORE CLOSE ABOVE 5400 LEVEL NIFTY WILL BLAST UP TO 5702-5746 LEVEL VERY SOON. CURRENTLY VERY STRONG SUPPORT IS AROUND 5323 AND THAN  5250-60 ON WEEKLY AND DAILY BASIS.

9 February 2012

Nifty close above 5400 level after three days consolidation. Today 5300 put Open  Interest  1,197,850 new contract added with total open interest at 6,875,300 contract.
Nifty 5400 call open Interest reduced  -189,250 contract today. while 5400 put Open interest added 1,174,600 new contract. seller are aggressive to sell the contract even 5400 put.
I told you before any close above 5400 will kiss 5520 level very soon.
 tomorrow sustaining above 5400 level will confirm  this rally towards 5520.


Yesterday market volatility was pre expected and i told you to short nifty around 5400 level. Intraday traders must have taken advantage of this sharp fall. Market is trading in very tight range from last three days. yesterday 5400CE OI ADDED 179800 NEW CONTRACT WITH total OI of 6067050. A huge Open interest buildup has seen in 5300 put with the addition of 864550 new contract. Another volatile session you may see today. Greek political leaders failed early on Thursday to sign off on a tough reform and austerity program, the price of a new international bailout for the nation. Above 5400 spot nifty and bellow 5280 spot nifty will give new direction of 150 -200 points.
 Option sellers are always be smart than buyers. what are the 5400CE sellers are saying? they are saying that come and buy 5400Call. Above 5400 all is yours. Market is returning from three days from 5400 level. OI IS 6067050. OK..... NOW THINK WHO IS SMARTER SELLER OR BUYER? Ans is always seller. well now will sellers like to go up the market who have sell 5400CE. NO...... NOT AT ALL. THAT'S WHY MARKET IS REVERSING EVERYDAY FROM 5400 LEVEL. ANY BAD NEWS FROM GLOBAL WILL CREATE SELLING PRESSURE IN MARKET. MARKET IS ALL READY IN OVER BOUGHT ZONE. NEED TO BE CAUTIOUS AT THIS LEVEL AND ACT LIKE AS A ROBERT WITH INDICATORS......... GOOD LUCK.

8 February 2012

YESTERDAY WE GAVE A BUY CALL IN NIFTY 5400 PE AT 96 AND WE BOOKED PROFIT AT 129 LEVEL YESTERDAY.
ENJOY PROFIT.
FOR NEXT MOVE OF NIFTY IT NEED SOME CONSOLIDATION. TREND IS UP. BUY OPPORTUNITY WILL BE AROUND 5240 LEVEL.
POSSITIONAL TRADER HOLD SHORT BY KEEPING STOP LOSS AT 5420 LEVEL.

5 February 2012

NIFTY VIEWS

ON 31st JANUARY WE TOLD YOU THAT NIFTY IS FLYING TOWARDS 5400. MY FIRST TARGET SHOULD ACHEAVE ON MONDAY. IT IS BLASTED OVER 200 DMA AND LONG TERM TERNDLINE. A MINOR CORRECTION WE MAY SEE FROM 5400 LEVEL TILL 5220. THEREAFTER MY SECOND TARGET 5600 WOULD ACHEAVE.
MONTHELY TREND IS UP NOW FROM 5217. OVERALL WE MAY SEE A ANOTHER BULL MONTH FOR NIFTY.
ON FRIDAY BULLS TOUCHED 5334 AND CLOSES AT 5325. NOW 5400 LEVEL SEEMS BIG RESISTANCE FOR BULLS. THEY HAVE TO TAKE SOME BREATH AND ALSO HAVE TO GET READY FOR THE DRIVE TO 5600 LEVEL.

3 February 2012

NIFTY

 NIFTY MAY RETOUCH 5100 LEVEL. NEWS AFFECTED IN INDIAN STOCK MARKET YESTERDAY.
 BOOK PROFIT IN 5200 CALL AT 150.00 LEVEL. BUY RECOMMENDED NEAR 95..
RS.5500 PROFIT IN NIFTY 5200 CALL IN TWO LOT.
ENJOY.............

1 February 2012

MARKET RECOVERED AFTER TWO HOUR CONSOLIDATION AND FINALY IT CLOSED ABOVE 200 DMA. EXPECT NONSTOP RALLY UP TO 5400.
I RECOMENDED YESTERDAY TO BUY 5200 CALL JUST SEE IT IS ON FIRE,
ENJOY!!!!!!!!!!!!!!!!!!.
MORE DETAILS TO OUR SUBSCRIBERS.
What Open Interest Tells UsA contract has both a buyer and a seller, so the two market players combine to make one contract. The open-interest position that is reported each day represents the increase or decrease in the number of contracts for that day, and it is shown as a positive or negative number. An increase in open interest along with an increase in price is said to confirm an upward trend. Similarly, an increase in open interest along with a decrease in price confirms a downward trend. An increase or decrease in prices while open interest remains flat or declining may indicate a possible trend reversal.
Rules of Open Interest
If prices are rising and open interest is increasing at a rate faster than its average, this is a bullish sign. More participants are entering the market, involving additional buying, and any purchases are generally aggressive in nature
If the open-interest numbers flatten following a rising trend in both price and open interest, take this as a warning sign of an impending top
High open interest at market tops is a bearish signal if the price drop is sudden, since this will force many 'weak' longs to liquidate. Occasionally, such conditions set off a self-feeding, downward spiral
An unusually high or record open interest in a bull market is a danger signal. When a rising trend of open interest begins to reverse, expect a bear trend to get underway
A breakout from a trading range will be much stronger if open interest rises during the consolidation. This is because many traders will be caught on the wrong side of the market when the breakout finally takes place. When the price moves out of the trading range, these traders are forced to abandon their positions. It is possible to take this rule one step further and say the greater the rise in open interest during the consolidation, the greater the potential for the subsequent move
Rising prices and a decline in open interest at a rate greater than the seasonal norm is bearish. This market condition develops because short covering and not fundamental demand is fueling the rising price trend. In these circumstances money is flowing out of the market. Consequently, when the short covering has run its course, prices will decline
If prices are declining and the open interest rises more than the seasonal average, this indicates that new short positions are being opened. As long as this process continues it is a bearish factor, but once the shorts begin to cover it turns bullish
A decline in both price and open interest indicates liquidation by discouraged traders with long positions. As long as this trend continues, it is a bearish sign. Once open interest stabilizes at a low level, the liquidation is over and prices are then in a position to rally again.
If prices are rising and the volume and open interest are both up, the market is decidedly strong. If the prices are rising and the volume and open interest are both down, the market is weakening. Now, if prices are declining and the volume and open interest are up, the market is weak, but when prices are declining and the volume and open interest are down, the market is gaining strength.

31 January 2012

NIFTY VIEWS

ME AND OUR CLINTS HAVE MINTED MONEY IN BOTH SIDE. YESTERDAY BOOKED PROFIT IN 5200 PE AT 150 AND BUY TODAY 5200 CALL TODAY AT 95.
TODAY I GAVE INFOSYS TO BUY AT 2725 IT WENT ABOVE 2750, IT IS ALSO GIVING 2500 PROFIT IN ONE LOT ONLY.

YESTERDAY NIFTY FALL 120 POINTS TODAY IT COVERED IT ALL FALL IN SINGLE DAY. NIFTY IS STRONG WITH ITS UP TREND. ONLY THING IS THAT IT IWAS OVERBOUGHT IN DAILY CHARTS.

I EXTREAMLY THING THAT NIFTY IS HEEDING TOWARDS 5400 -5600. CONSIDER THIS RALLY AS PRE BUDGET RALLY.

ONCE MORE SINGLE CLOSE ABOVE 5200 NIFTY WILL JUMP TO 5400 VERY SOON.

WE GAVE A BUY CALL OF 5200 CE AT 95 TO OUR PAID SUBSCRIBER.

JUST SEE WHAT HAPPEND TO BHEL YESTERDAY IT SLIPED MORE THAN 10 %.

30 January 2012

NIFTY FUTURE

 TODAY VERY GOOD PROFITABLE DAY . I TOLD TO BUY 5200 PUT AT 115.00. OUR PAID CLINT HAS MADE RS 6000.00 TODAY ONLY IN NIFTY. MORE PROFITABLE TRADE IS AHEAD. MORE DETAILS TO OUR SUBSCRIBERS.


NIFTY FUTURE SLIP  107 POINTS TO 5105. 5121 LEVEL WAS IMMEDIATE SUPPORT WHICH IS BROKEN TODAY. NOW IMMEDIATE SUPPORT COME AT 5050 LEVEL, AND IT WILL FACE STRONG SUPPORT AT 5009 LEVEL. AFTER BREAKING OF 5009 LEVEL  THE BALL WILL BE WITH BEARS. WATCH THE LEVEL CAREFULLY.
TREND IS UP. CONSIDER THIS FALL ONLY AS CORRECTION.

BHEL BLOOD BATH TODAY. SEE WHAT I RECOMMENDED BELLOW. HOPE YOU ALL WOULD HAVE ENJOYED IT. 


THIS IS TRAILER ONLY IF YOU WANT TO ENJOY THE FULL MOVIE, SUBSCRIBE WITH US. NEW BATCH IS GOING TO START.

29 January 2012

IRB INFRA DEV LTD.

 BUY IRB INFRA DEV LTD ABV 174.50 TARGET 185-190. KEEP STOPLOSS AT 168. HOLD FOR A WEEK.

28 January 2012

BHEL

SELL BHEL BELLOW 271.50 TARGET 255-250 KEEP STOPLOSS AT 275.60 AND HOLD FOR 3-4 DAYS

NIFTY FUTURE

Nifty Future : Nifty future we have written  that it will face immediate resistance  at its 200-day SMA near 5219. Just check how it checked the level in the friday session.  What was your trade for the day?  huge open interest  build up in 5300 CE and 5000 PE. Data shows that once nifty will fall to 5040 level. Nifty February series begin with writing 5000PE strike price with highest open interest among the series. Also there is condierable amount of option interest visible in 5200CE and 5300CE. Spike in open interest in these option strikes in the upcoming sessions could drag the nifty towards 5040 level.

27 January 2012

 NIFTY WILL GIVE FIRST FALSE BREAKOUT THEN IT WILL FALL TO 5040 LEVEL. IT HAS NEVER MOVE UP IN ONCE AFTER CROSSING 200 SMA.
BUY 2 LOT 5200 PUT AT 115. STOPLOSS WILL BE AT 5240 SPOT NIFTY ON CLOSING BASIS.

Difference Between Options Volume and Open Interest               
In stock trading, you measure stock market activity & liquidity by volume. In
options trading, there are two measurements: Open Interest & Volume.
Unlike in stock trading, whereby there is a fixed number of shares to be traded
(i.e. number of outstanding shares), in options trading, new option contracts
need to be created when a trade is placed and there is no existing contract yet.
When a new expiration month initiated, there is no open interest because there are no option contracts being traded for that month yet. As trading builds up, open interest will also increase. Now, what is Open Interest?
Open interest is the total number of option contracts that are still open (i.e.
have not y et been exercised, or have not been closed out by an offsetting
transaction, or have not expired).
Open interest increases when new contracts are created by options buyer and seller, whereby a new buy er takes a new long position and a new seller takes a new short position.
On the other hand, open interest decreases when both the options buyer and seller with existing position close out their respective positions and the contract disappears.
Closing out the position can be done by doing an offsetting transaction (i.e.
the existing buy er sells the option to close his long position while the option seller buy s back the option to close his short position), or by exercising the Please bear in mind that open interest only increases when new contracts are created. Hence, when a trader who does not have a position in the option before buys from another trader who has an existing long position and want to close his position by selling his option contract, open interest does not change because a new contract is not created.
Then, what is volume in option trading and how options volume is different from open interest?
Options Volume is the number of option contracts traded during a given
period of time. Hence, volume reflects the number of options contracts that
changed hands from a seller to a buyer, regardless of whether it is a new contract being created or just an existing contract.
For more clarity , lets see the examples below:
On Day 0, Open interest = 0, Option Volume = 0.
On Day 1 , A buy s 2 option contracts and B sells 2 option contract.
Open interest = 2, Option Volume (for that day ) = 2.
On Day 2, C buy s 7 option contracts and D sells 7 option contracts.
Open interest = 2 + 7 = 9, Option Volume (for that day ) = 7 .
On Day 3, A closes out his position by selling 2 option contracts, and D closes out part of his position too by buy ing back 2 of his option contract.
Open interest = 9 - 2 = 7 , Option Volume (for that day ) = 2.
Open interest reduced by 2, because A & D have an existing position before, so this transaction is an offsetting transaction to close out their respective
positions. As a result, 2 contracts disappear.
On Day 4, E buy s 3 option contracts from C who wants to sell part of his option contracts (3 contracts).Open interest = 7 (no change), Option Volume (for that day ) = 3.
When E buy s from C, it does not create new contracts. E who does not have a position in that option before simply replaces C who wants to exit his long
position. Hence, open interest does not change.

24 January 2012

I have given three charts  . on daily charts there is a strong trend line resistance near 5168- 5200. on weekly chart nifty is showing strong resistance near 5200 level. two closing above 5200 nifty will jump to 5400 level.
But the question is will nifty cross the trend line?
ok now consider the charts. on daily and weekly charts RSI, SLOW STOCHASTIC, are showing over bought situations. so I strongly think that once nifty will comeback atleast 4900 level.
FROM DOWNSIDE  It will face strong support at 5000 level. any close below 5000 nifty may slip to 4900-4850. 

21 January 2012

NIFTY SUPPORT AND RESISTANCE LEVEL FOR 23 JAN 2012

                       .NIFTY SUPPORT AND RESISTANCE LEVEL FOR 23 JAN 2012
                                                      Pivot Level = 5043
 

                           Support1 = 5021                   Resistance1 = 5079

                           Support2 = 4984                   Resistance2 = 5100

                           Support3 = 4963                   Resistance3 = 5137

19 January 2012

DONT YOU THINK ITS A TREND REVERSAL SIGN

 MOSTELY STOCKS ARE ROCKING UP GIVING STRONG BUY SIGNALS. I SEE VERY STRONG REVERSAL IN MARKET ON DAILY AND WEEKLY CHARTS. ONCE IF IT CROSS ABOVE 5100 AND SUSTAIN ABOVE THIS LEVEL MARKET WILL GIVE SMART MOVE. MARKET TODAY CLOSE AT 5018 WATCH THE MOVEMENT TILL RBI MEETS ON 24TH JANUARY. IF TILL THAN IT CROSS ABOVE 5100 NEXT TARGET WILL BE 5400 VERY SOON AFTER SOME MINOR CORRECTION. MY GUTS SAYING THAT THIS MONTH CLOSING WILL BE AROUND 5200.

15 January 2012

nifty weekly outlook 16/01/12 - 20/01/12

TECHNICAL VIEW
****************

LAST(13/01) CLOSE@4866 (+35 POINTS)

LAST HIGH@4898 LOW@4834
WEEKLY HIGH@4898 LOW@4686

5DMA@4830
20DMA@4731
50DMA@4861
200DMA@5246


POSITIVE ABOVE 4888.
NEXT RESISTANCES AT 4911 AND AT 4933.
NEGATIVE BELOW 4844.
NEXT SUPPORTS AT 4822 AND AT 4800.


5-DAY RSI 72 AND 14-DAY RSI 57.
INDICATES NIFTY PLACED IN BULLISH ZONE.


WEEKLY KEY RESISTANCE@4933/5022
WEEKLY PIVOT @4844
WEEKLY KEY SUPPORT@4755/4666


EXPECTED RANGE FOR 16/01/2012
IN SPOT 4800-4933

16 October 2011

NIFTY VIX HAS BROKEN ITS TREND LINE SUPPORT AND CLOSED AT 26 LEVEL. SEE THE CHART GIVEN ABOVE. SUSTAINING BELOW 26 LEVEL AGAIN IT IS A BULLISH  FOR NIFTY. MOVE ABOVE 26 AND ABOVE ATHE TREND LINE RESISTANCE WILL BRING A PAUSE IN NIFTY AND CORRECTION MAY START .

FII HAS BOUGHT 77542 CONTRACT IN NIFTY IN THIS SERIES TILL FRIDAY WITH THE AVARAGE BYING PRICE AT 4771. SO THEY ARE IN PROFITS OF ALMOST 300 POINTS AND VERY WELL CAN GO AHEAD OF BOOK PROFITS.

NEED TO BE ALERT AT 5169 LEVEL.

Disclamer:-

Futures and Options trading have large potential rewards, but also large potential risk. You must be aware of the risks and be willing to accept them in order to invest in the Futures and Options markets. Don't trade with money that you can't afford to lose. This is neither a solicitation nor an offer to Buy/Sell Futures or Options.

The contents of this site are for general information purposes, only. The strategies/plan discussed above in this thread/site is made by me based on data which is operated and maintained by third parties. However it is tested and proved every attempt has been made to assure accuracy, but it is by me only. We assume no responsibility for errors or omissions. Examples on this site and in the manual are provided for illustrative purposes and should not be construed as investment advice or strategy. The future data manual is for informational purposes only. These predictions/tips are technical , based on charts conditions ONLY. This is only a guideline, the decision has to be taken after logical thinking by you. Technical analyst and astrologist will not be liable for any personal or financial losses or profits.

The information and views in this website & all the services we provide are believed to be reliable, but we do not accept any responsibility (or liability) for errors of fact or opinion. Users have the right to choose the product/s that suits them the most.

By your act of reading this independent and individual market research, you fully and explicitly agree that Rajesh Singh or My website (www.niftyeyes.blogspot.in/www.niftyeyes.in) will not be held liable or responsible for any decisions you make regarding any information discussed herein. Take a proper advice from a certified adviser before invest in future and option market.