AUTOMATED TRADING

AUTOMATED TRADING

6 December 2013

BE CAUTIOUS LONG SIDE NOW

Nifty open gap up and traded down whole day. We have seen clear five wave completion on nifty hourly chart with negative divergence as shown in picture below. Any up move from here may extend the fifth wave. Channel breaking downside will confirm that down move has started. Some more chart like infosys, LT, etc are also showing negative divergence. so be cautious towards long side.
What if you believe a stock will continue to fall but would like to short at a better price or a less risky entry? Well guess what? There is a way! It’s called divergence trading.

In a nutshell, divergence can be seen by comparing price action and the movement of an indicator. It doesn’t really matter what indicator you use. You can use momentum indicators.  The great thing about divergences is that you can use them as a leading indicator, and after some practice it’s not too difficult to spot.
When traded properly, you can be consistently profitable with divergences. The best thing about divergences is that you’re usually buying near the bottom or selling near the top. This makes the risk on your trades are very small relative to your potential reward.
Higher Highs and Lower Lows
Just think “higher highs” and “lower lows”.
More details to our club members................
Learn fantastic way of technical analysis absolutely free and get daily recommendation free.


4 December 2013

LONG SIDE IS BETTER DIRECTION

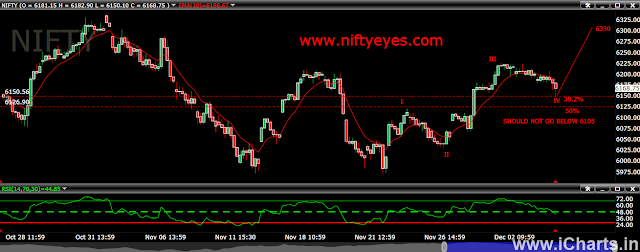
Long side trade is better direction for nifty than short side till nifty is above. See the below chart. It seems five wave moves on pattern  and fifth is due. This count will be invalid if nifty go below 6105 level. So I think that minor dip is buying opportunity.

3 December 2013

My latest view

Nifty continued to move higher in a very tight range. The trend is still cautiously positive as long as it is protecting 6110 level.

As shown in 60 mins chart below, prices are moving higher in an upward channel. As long as this channel is intact the trend will remains positive. Once nifty cross above 6220, prices may kiss 6350 level very soon.  If break 6140 will result into break of the channel and so one can now trail stops for existing long positions towards this level. 
 Nifty is struggling since 2008 onwards around 6350 level which is next big resistance which it has not crossed yet. But momentum looking this time strong and I expect that Nifty should also make life time highs.
However, we are seeing only 4 to 5 max green candles for over a year now.  So any consecutive more than 5 green days will provide hint that trend is changing on longer term basis But any move below 6110 will indicate the upside move was another short trend affair only and the range bound movement will then continue. 

In short any move above 6220 will infuse buying force upto 6350-6400 level, and any move below 6110 there will be high chances to re taste 5970 level.


1 December 2013

NIFTY NEXT TREND

PUT CALL RATIO, OPTION OPEN INTEREST DATA AND CHART PATTERN ALL ARE IN FAVOR OF BULLS.
ABOVE 6220 BULLS TARGETING 6500 IN FEW WEEKS.
UNTIL NIFTY IS PROTECTING 6100 LEVEL THERE IS POSSIBILITIES OF TOUCHING OF 6500 LEVEL.  


Disclamer:-

Futures and Options trading have large potential rewards, but also large potential risk. You must be aware of the risks and be willing to accept them in order to invest in the Futures and Options markets. Don't trade with money that you can't afford to lose. This is neither a solicitation nor an offer to Buy/Sell Futures or Options.

The contents of this site are for general information purposes, only. The strategies/plan discussed above in this thread/site is made by me based on data which is operated and maintained by third parties. However it is tested and proved every attempt has been made to assure accuracy, but it is by me only. We assume no responsibility for errors or omissions. Examples on this site and in the manual are provided for illustrative purposes and should not be construed as investment advice or strategy. The future data manual is for informational purposes only. These predictions/tips are technical , based on charts conditions ONLY. This is only a guideline, the decision has to be taken after logical thinking by you. Technical analyst and astrologist will not be liable for any personal or financial losses or profits.

The information and views in this website & all the services we provide are believed to be reliable, but we do not accept any responsibility (or liability) for errors of fact or opinion. Users have the right to choose the product/s that suits them the most.

By your act of reading this independent and individual market research, you fully and explicitly agree that Rajesh Singh or My website (www.niftyeyes.blogspot.in/www.niftyeyes.in) will not be held liable or responsible for any decisions you make regarding any information discussed herein. Take a proper advice from a certified adviser before invest in future and option market.