AUTOMATED TRADING

AUTOMATED TRADING

2 January 2014

INDIAN MARKET LATEST UPDATE

Market opened flat but suddenly it move up and broke previous resistance level at 6345 but it slide nonstop in second half. Since past one week we have been written to our clients that 40% stocks are showing negative divergence on daily or hourly chart, and advised to trade cautiously. Further Nifty has broken it range in which it was spending time from last week and closed today its previous week low. Bias are totaly negative on daily and weekly basis. Bollinger band provide us very useful support and resistance level in range bound market. As per nifty daily chart Bollinger band support is around 6134. All important momentum indicators are showing reversal on pattern.
As per Elliott wave we can assume that this down move is c wave and it may touch 5970 level very soon. After that we will consider that nifty enter again in third standard of correction or it will fall further after little up move.
Get our daily resource and recommendation absolutely free 
for details feel free to call us - 7766904776
or mail us at eyesnifty@gmail.com


31 December 2013

NIFTY AND STOCKS UPDATE FOR 31 DEC

SBIN

NIFTY
We have some alternate view on nifty. We have labelled as per Elliott wave perspective in chart below.
Lots of stocks showing negative divergence on chart. Trading towards upside should be very cautious. Why we are saying this because nifty above 6320 level has failed to show strong momentum 
The overall structure is not looking  impulsive as of now. This increases the possibility that wave b from the high of 6415 is still ongoing in the form of Flat correction. We need few more days to confirm the next move. Trade Intraday for few days.

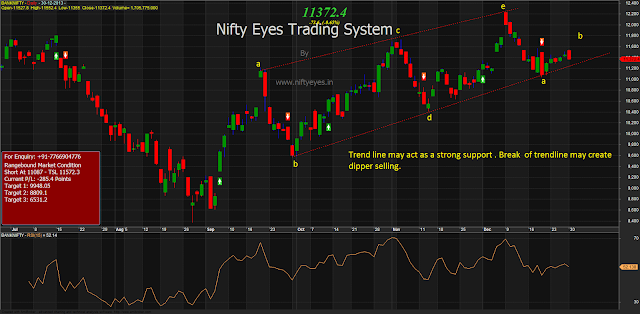
BANK NIFTY

HPCL


Disclamer:-

Futures and Options trading have large potential rewards, but also large potential risk. You must be aware of the risks and be willing to accept them in order to invest in the Futures and Options markets. Don't trade with money that you can't afford to lose. This is neither a solicitation nor an offer to Buy/Sell Futures or Options.

The contents of this site are for general information purposes, only. The strategies/plan discussed above in this thread/site is made by me based on data which is operated and maintained by third parties. However it is tested and proved every attempt has been made to assure accuracy, but it is by me only. We assume no responsibility for errors or omissions. Examples on this site and in the manual are provided for illustrative purposes and should not be construed as investment advice or strategy. The future data manual is for informational purposes only. These predictions/tips are technical , based on charts conditions ONLY. This is only a guideline, the decision has to be taken after logical thinking by you. Technical analyst and astrologist will not be liable for any personal or financial losses or profits.

The information and views in this website & all the services we provide are believed to be reliable, but we do not accept any responsibility (or liability) for errors of fact or opinion. Users have the right to choose the product/s that suits them the most.

By your act of reading this independent and individual market research, you fully and explicitly agree that Rajesh Singh or My website (www.niftyeyes.blogspot.in/www.niftyeyes.in) will not be held liable or responsible for any decisions you make regarding any information discussed herein. Take a proper advice from a certified adviser before invest in future and option market.