AUTOMATED TRADING

AUTOMATED TRADING

22 February 2013

INTRADAY SETUP TRADE

TIME TO TIME I HERE POST INTRADAY TRADING CHART WHICH HAS BEEN MADE BASED ON INTRADAY SETUP.
IN THE EXAMPLE BELOW I HAVE SHOWN THAT HOW YOU CAN MAKE MONEY EVEN IN VERY TIGHT RANGE BOUND MARKET.
TODAY MARKET MOVED IN VERY TIGHT RANGE BUT WE MADE PROFIT IN WIDE RANGE.
ACCORDING TO OUR INTRADAY SETUP SELL SIGNAL DETECT AT 5870.58 WITH STOP LOSS AT 5876.58. THIS LEVEL IS CLEARLY VISIBLE IN SETUP PICTURE BELOW.
IN INTRADAY NIFTY COME AT 5870 AT 2.35 PM AT THE SAME TIME AS SIGNAL CAME I BOUGHT 20 LOTS 5900 PUT AT 65. ( SEE THE CHART BELOW) AND AFTER 35 MINUT I SOLD AT 75.
20 LOTS X 10 POINTS = 1000 x 10 = RS.10000/00 PROFIT IN A SINGAL DAY.
WHAT ELSE YOU WANT.
IF YOU ARE TRADING WITHOUT INTRADAY SETUP MEANS YOU ARE DOING ADVENTURE WITH YOUR CAPITAL.
BUY INTRADAY SETUP. EVERYDAY WILL BE YOUR DAY. DON'T DO ADVENTURE WITH YOUR CAPITAL. "WINNERS DON'T DO DIFFERENT THINGS. THEY DO THINGS DIFFERENTLY"


MARKET UPDATE

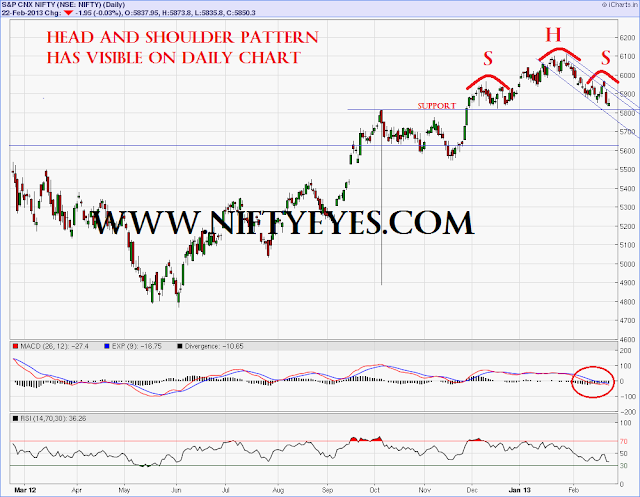
Nifty next big support is coming around 5630 and trend will remain highly negative and I expect 5630 level will come very soon. This down side view will be invalid if nifty cross 5920 level. As long as bear will protect this level probabilities will remain high that nifty will come 5630 level. Avoid long trade further unless nifty break above level.
Strategy:-
Sell on Rise around 5870-90 with stop loss at 5920 keep positional target 5630-50.  

21 February 2013

KIND ATTENTION PLEASE

Dear viewers,

If nifty break 5800 then 5630 level may come very quickly. Fresh Long Position can be made only above  5880.
Subscribe our CRASH COURSE and become Trading Super star in stock Market which may give you Financial Freedom in just five years.....
" WINNERS DON'T DO DIFFERENT THINGS. THEY DO THINGS DIFFERENTLY"


NIFTY X-RAY REPORT FOR 22 FEB

Nifty future slide highest in last seven months. A big bearish engulfing pattern has formed on nifty EOD chart. Earlier I thought that nifty will formed five wave pattern on hourly chart but it went invalid as it broke 5925 in morning session, which I have posted in my last post that keep stop loss at this level and be on long side. It seems that it formed A,B,C pattern, and if this count is ok then Nifty should reverse from 5820 level and C wave should take nifty once again towards 6000 level. I highly expect that last four days till expiry is going to blast if nifty hold 5800 level. Remember I am saying if hold 5800 level.
Fiis sold 16440 contracts of index future worth Rs. 486 cores and open interest decreased by 7418 contracts indicating that Fiis are not aggressive for short side. They have bought huge 1213 cores in cash market segment, giving indication that they have use the dip for buying. Why they are buying in dip when everybody is bearish in current market situation. This all compel me to think that up move is possible in near term. Lets consider Option open interest data.
Nifty 5800 put added 10,89,100 contracts in open interest and this strick has highest open interest on put side suggesting that 5800 level may give base to nifty. Open interest has added in falling market condition. Nifty 5900 call added 21,20,500 contracts in open interest. Option data suggesting that 5800 may give pause to bears and nifty may try to recover in c internal wave. Put Call ratio is at 0.88 also suggesting for reversal in market.
As per RSI on EOD chart is in oversold area indicating investor should cautious on short side and tomorrow may form bottom on Nifty. Mettle sector is in highly oversold zone may give nifty boost up.
Strategy for 22 Feb:- If nifty come near 5820-26 book profit in short and go reverse with the trade with strict stoploss at 5794 level.
GOOD LUCK
   

BLOOD BATH

20 February 2013

RELIANCE COMMUNICATION


RELIANCE INDUSTRIES


NIFTY X-RAY REPORT FOR 21 FEB

NIFTY FACED RESISTANCE AROUND 50 DMA AND CLOSED BELOW THIS LEVEL. AS NIFTY FUTURE UP BY 10 POINTS AND OPEN INTEREST INCREASED BY 1.4% INDICATING THAT FRESH LONG POSITION HAS ALSO BEEN ADDED INTO THE MARKET TODAY. AS PER NIFTY EOD CHART THREE CONSECUTIVE GREEN CANDLESTICK PATTERN WAS SEEN TILL YESTERDAY. IN SHORT TERM TREND IS POSITIVE WITH RESISTANCE NEAR 5983 AND 6013 LEVEL. USE THIS LEVEL FOR SELL FOR MID TO LONG TERM PERSPECTIVE. FII BOUGHT INDEX FUTURE WORTH RS 366 CORES WITH INCREASE IN OPEN INTEREST INDICATING THAT SHORTS HAVE BEEN COVERED TODAY.
AS PER NIFTY HOURLY CHART IT SEEMS THAT 1,2,3,4 WAVE HAS COMPLETED AND FIFTH IS DUE TO 6010. IF WE DON'T SEE ANY WAVE EXTENSION ON HOURLY CHART THEN 6010 WILL BE TERMINATION POINT OF THIS UP MOVE. KEEP 5925 AS STOP LOSS FOR ALL LONG TRADE NOW FOR THE TARGET OF 5990-6010.


BOOK PROFIT DLF


DLF BLASTED  SAFE TRADERS BOOK PROFIT IN DLF AROUND 279. BUY RECOMMENDED TWO DAYS BACK AROUND 265.

SUBSCRIBE OUR CROREPATI PLAN TO ENJOY GOOD, BETTER, BEST CALL.
ENJOY............................

19 February 2013

NIFTY X-RAY REPORT FOR 20 FEB

As I had indicated in my previous post that nifty may took support on rsi double bottom. Nifty made short term bottom at 5854. As nifty future was up by 49 points and open interest increased by 2.8% indicating fresh long position has been made into the market today. Three consecutive green candlestick pattern has formed on Nifty EOD chart and has given breakout above 15 days falling trend line as shown in chart below, indicating further green trend. Nifty is near its 50 day moving resistance. once if cross and sustain above 50DMA it may touch 5983-6013 level very soon. According to option open interest data 5900 put added 565350 contracts and 5900 call decreased by 749500 contracts from open interest indicating call writers have exited from 5900 call and writing in 5900 put seen today.
Hurdle around 5960 after that no problem for bulls till 5983 -6013.


NIFTY ELLIOTT WAVE COUNT

15 February 2013

ELLIOTT WAVE DIRECTION

NIFTY UPDATE

NIFTY UPDATE

WATCH CAREFULLY 5880 LEVEL. A SHORT TERM BOUNCE IS EXPECTED. PRICE IS TRADING AT LOWER LEVEL OF BO LINGER BAND. BREAK OF 5880 PRICE MAY FALL TO 5850 LEVEL. IF 5880 HOLD IN TODAYS SESSION THEN A JUMP ABOVE 6000 MAY SEEN.

14 February 2013

CATCH IT OR MISS IT

EVERYDAY WILL BE YOUR PROFIT DAY. 


HOW IT IS POSSIBLE. IS IT TRUE ? 
YES 100% TRUE. THOSE PEOPLE WHO HAVE BOUGHT THIS ARE REALLY LUCKY.
I JUST SHOW YOU TODAYS EXAMPLE
HOW MANY OF YOU HAVE PLANED NIFTY TO BUY AT 5912 SPOT LEVEL. THE PERSON WHO HAVE ALREADY BOUGHT INTRADAY SETUP THEY MUST HAVE BOUGHT.
JUST SEE THE SETUP AND SEE THE CHART.
TODAY WE BOUGHT 5900 CALL AT 77 AT RIGHT TIME WHEN NIFTY CAME TO OUR BUY SIGNAL LEVEL AT 5912 WITH STOPLOSS OF SIX POINT AT 5906
WE BOUGHT 5900 CALL 20 LOTS AT 77 AT THAT TIME AROUND 10.55 AM  AND BOOKED BROFIT AT 87. JUST SEE THE SETUP AND 5900 CE INTRADAY DAY CHART TO CONFIRM.
RS 10000/00 PROFIT IN JUST FEW MINUTE. TOTAL CAPITAL INVESTED 77000 ONLY. WHAT ELSE YOU WANT. CATCH IT  OR MISS IT. 
IF YOU DON,T HAVE INTRADAY SETUP THEN YOU ARE MISSING NOT SOMTHING BUT YOU ARE MISSING EVERYTHING. GOOD LUCK.
CLICK ON PICTURE FOR ITS LARGER VIEWS


13 February 2013

NIFTY X-RAY REPORT FOR 13 FEB

NIFTY OPEN GAP UP TODAY BUT SELL OFF CAME IN LATTER PART IN NIFTY BUT IT CLOSE ABOVE YESTERDAY LEVEL. NIFTY TOOK SUPPORT AROUND 5880. FIIS BOUGHT INDEX FUTURE WORTH RS 152 CORES AND OPEN INTEREST INCREASED BY 0.5% SEEMS LONG POSITION HAS BEEN CREATED INTO THE SYSTEM TODAY. NIFTY 5900 PUT ADDED 829,600 FRESH CONTRACTS IN OPEN INTEREST AND 5900 PUT OI STANDING HIGHEST OPEN INTEREST INDICATING STRONG BASE FOR NIFTY FOR CURRENT SERIES. I FEEL  IF NIFTY HOLD 5921 IN TOMORROW SESSION THAN EXPECT A STRAIGHT RALLY UP TO 5990-6020 VERY SOON.  

WE GAVE A BUY CALL IN SBI ABOVE 2328 BUT DIDNOT EXECUTE IN TODAY SESSION. SBI CLOSED AT 2254 TODAY WAIT FOR CONFIRMATION GOOD BUYING OPPORTUNITY MAY OCCUR.

STATE BANK OF INDIA

JUST ARREST SBI ABOVE 2328 STOP LOSS 2285 AND HOLD FOR FEW DAYS.


NIFTY UPDATE FOR 13 FEB

BREAKING OF TREND LINE WILL DECIDE THE NEXT MOVE ON NIFTY. AS WE ARE SEEING THAT NIFTY HAS GIVEN UP SIDE BREAKOUT ON HOURLY CHART SO POSSIBILITIES OF UPSIDE REMAIN IN THE MARKET. RSI AND SLOW STOCHASTIC IS IMPROVING UPSIDE SUPPORTING UPSIDE VIEWS. BUY CALL CAN BE INITIATED ON NIFTY ABOVE 5940 WITH STOPLOSS AT YESTERDAY'S LOW. 
LETS SEE
GOOD LUCK


11 February 2013

NIFTY X-RAY REPORT FOR 12 FEB

Nifty hit one month low today but closed around same level and took support around 5883 level in intraday. If hold this level for tomorrow session then expect sharp and impulsive bounce from here otherwise a fall upto 5840 may be seen in Market. Nifty is taking support around 38.2% retracement level. Fiis bought index future worth Rs. 382 cores and open interest increased by 0.9% indicating that fresh long position has been created into the system today. Fiis were frequent buyer in cash market segment and in stock future segment. Yesterday huge buying in cash market segment indicating that there is nothing like panic situation in the market. However Nifty has broken important support and long term trend line support I still expect a sharp bounce and new high in the market but i also expect that nifty may trap bears at current level and it may slip to 5840 also. Option OI data is indicating volatile session for tomorrow. Nifty 5900 PUT highest OI data indicating hurdle around this level. As per nifty EOD chart RSI and Slow stochastic is in oversold zone so nifty may bounce from here. 
Buy trade can be initiated at 5865 spot level (if come) or above 5930 spot level in tomorrow session.

Are you stressed with your trading style or are you not confident with your trading then buy our new Intraday trading setup and earn tension free trading in equity and derivative. 
Don't trade hard Trade smart with Intraday trading setup. 

7 February 2013

NIFTY X-RAY REPORT FOR 08 FEB

Nifty is near its long term trend line support support from 4770 but has give closing below 50 DMA. And this trend line will decide the next move of nifty, Will this time also nifty take support and reverse or it will break the trend line. Lets consider......
Since last two days nifty price is falling and but open interest is decreasing. No indication of fresh short position in index future. 5900 put added 736,750 shares in open interest indicating base on this zone. As per Nifty EOD chart slow stochastic has placed into oversold zone indicating may reverse in near time.
Watch the level carefully tomorrow is very crucial day and tomorrow will decide the next trend. Nifty next support is coming at 5917-5905

BE A TRADING HERO

TRADE HARD OR TRADE SMART
CHOICE IS YOURS.
Hey friends I am going to show you another example of Intraday setup.This setup is giving mind blowing signal every day. I am saying all of you don,t adventure with your hard earned capital in stock Market. First of all just see what the signal coming. with this setup.
see the picture below.
As you are seeing that Setup is giving buy signal level 1 at 5937 and buy signal level 2 at 5925
and setup is giving sell signal at level 1 at 5975.35 and sell signal level 2 at 5987.
So as per my setup rule sell signal has come at 5975.35 at 10.15 AM with the stoploss coming at 5981.
so I decided to buy 6000 put.
I bought 20 lots( 1000 Qnty) 6000 put at 81.50 as nifty reached at 5975 and booked profit at 86.50
Total 6 points. total profit 6000 today. Total capital invested RS.81500/00
I have posted below 6000 put chart and intraday setup to confirm.
Enjoy trading.
BUY INTRADAY SETUP AND EARN DAILY 5000 ON 1 LAC INVESTMENT.
CONTACT FOR 
CLICK ON CHART TO ENLARGE


6 February 2013

Notice

Dear viewers,
The website would not be updated today. And I will be absent from market also.
 I will be back tomorrow
Regard

5 February 2013

MCDOWELL


NIFTY X-RAY REPORT FOR 06 FEB

Bearish gap down Candlestick pattern has formed on NIFTY today and gave the downtrend signal and Nifty  has hit two week low today. As per slow stochastic indicator NIFTY is in over sold range now . Consecutive three black crows Candlestick pattern was formed by NIFTY .  NIFTY has moved below 20 days Exponential Moving Average after 46 days on 01/02/2013 and took support today at 50 day Moving Average. Global Indices has turned positive and this indication may give positive strength to nifty.
Nifty 5900 put added 10,30,250 contracts in open interest  Indicating hurdle around this level. Fiis sold index future worth rs 663 cores and open interest increased by 6345 contracts indicating fresh short position has been made. But I really don't understand the Fiis activities that how they make money.According to Nifty EOD chart a clear triangle pattern has formed and Lower side long term trend line is ready to give nifty support. On the Upside fresh breakout will require to give fresh move on nifty. 
nifty will face resistance around 5990 and 5934-24 will act as support for next days.     

AMBUJA CEMENT

BE A TRADING HERO

Hey friends Just buy intraday and positional setup and be a trading hero.


Below I am just going to show you about todays trade according to setup.  which I have posted below this message. As you are seeing that Nifty trading in very tight range and i am going to show you how you make profit in this type of tight range. As per Our intraday setup it is giving best buy signal at 5951.93.(see the setup picture below) So I decided to buy 600 call at that level. I bought nifty 20 lots  6000 call at 64 around 12.25 minute as nifty came at 5951.93 with the stop loss coming at 5945.92 spot nifty price.
Lets see what happened in  intraday. If you have not a proper intraday trading setup you are just doing adventure with your capital. OK come to the point .........
I bought 6000 call at 64 just see the chart what happened. at 13.50 nifty 6000 call went to 74.35. I booked profit safely at 70 rs.
20 lots = 1000 qnty X 6= 6000
brokerage 275.00= 6000-275=5725 Rs net profit in very range bound market. You may earn better money if you get wider range of movement in nifty.
Similarly you may make money every day in stocks and bank nifty future.
Don't do adventure with your capital and buy Intraday trading setup and BE a trading hero.
I have shown 600 call chart and setup picture for confirmation. This was the example of very tight range trading where trader always loose money.

BUY INTRADAY AND POSITIONAL SETUP AND START MAKING MONEY FROM DAY ONE

In spite of this showing the confirm setup if you are not ready to understand all these things then I would like to say god bless you my dear friends.
Have A good Luck
                               CLICK ON PICTURE FOR ITS LARGER VIEWS

4 February 2013

NIFTY X-RAY REPORT FOR 05 FEB

Consecutive six days red candle stick pattern has seen on daily chart. As per nifty chart shown below 5965-5950 is good support for nifty on Daily chart according to wave theory. Fiis sold index future worth Rs. 710.33 cores and open interest increased in index future by 4.7% indicating short position has been made by Fiis. Fiis bought 856 cores in cash market segment. 
Nifty 6000 call added 1,36,450 contracts in open interest and 6000 put added 356,750 contracts and it is standing with highest open interest on the put side. Indicating volatile move between 5900 and 6000 strike.
Long term trend line support is coming around 5935 and this trend line will decide the further trend in our Indian market. If support taken smart V shape recovery is expected in our market. Put call ratio is at 0.90 indicating that it is near its reversal level from where it generally reversed. tomorrow will be crucial day for nifty for trend setup. Fiis made long position in stocks future worth rs 376.61 cores.
positional buy nifty around 5951-65 (spot) keep strict stoploss at 5930 (spot) and fix target according to your hunger.
More details to our subscribers................. 


HINDALCO LOOKING GOOD


KEEP AN EYE ON HINDALCO LOOKING GOOD TO BUY. BUY THIS STOCK IN FALL BETWEEN 110-111 STOPLOSS 109 ON CLOSING BASIS AND KEEP TARGET FOR 122-124 IN FEW DAYS.


Disclamer:-

Futures and Options trading have large potential rewards, but also large potential risk. You must be aware of the risks and be willing to accept them in order to invest in the Futures and Options markets. Don't trade with money that you can't afford to lose. This is neither a solicitation nor an offer to Buy/Sell Futures or Options.

The contents of this site are for general information purposes, only. The strategies/plan discussed above in this thread/site is made by me based on data which is operated and maintained by third parties. However it is tested and proved every attempt has been made to assure accuracy, but it is by me only. We assume no responsibility for errors or omissions. Examples on this site and in the manual are provided for illustrative purposes and should not be construed as investment advice or strategy. The future data manual is for informational purposes only. These predictions/tips are technical , based on charts conditions ONLY. This is only a guideline, the decision has to be taken after logical thinking by you. Technical analyst and astrologist will not be liable for any personal or financial losses or profits.

The information and views in this website & all the services we provide are believed to be reliable, but we do not accept any responsibility (or liability) for errors of fact or opinion. Users have the right to choose the product/s that suits them the most.

By your act of reading this independent and individual market research, you fully and explicitly agree that Rajesh Singh or My website (www.niftyeyes.blogspot.in/www.niftyeyes.in) will not be held liable or responsible for any decisions you make regarding any information discussed herein. Take a proper advice from a certified adviser before invest in future and option market.