21 May 2013
NIFTY UPDATE
20 May 2013
NIFTY ELLIOTT WAVE CURRENT UPDATE
19 May 2013
INDIAN STOCK MARKET WEEK AHEAD
Nifty gained consecutive five weeks, as the momentum indicators are showing overbought zone therefore the Indian stock market may spend time in some consolidation next week. Movements are likely to be a bit range bound in next week, although a few front line stocks are expected to see some buying amid consolidation in index. Quarterly results from top companies, including State Bank of India, Oil India, Tech Mahindra, Larsen & Toubro, BHEL, Tata Steel and JSW Steel will give impact on direction of Indian market next week.
Adani Enterprises, Apollo Hospitals Enterprises, Divi's Laboratories, IFCI, Thermax, Hindustan Copper, Welcorp, TV Today, Dish TV India, Jet Airways and Spice Jet are among the other companies that will announce their quarter results next week.
We have seen heavy buying by Foreign Institutional Investors in previous five weeks which contributes significantly to the market's gains last week, The U.S. markets closed on a high on Friday (17 May) on the back of some impressive economic data, may help the Asian market start with positive note on Monday.
IT bellwether Infosys will be in focus following the Income Tax department slapping a fresh tax demand of Rs 582 crore on the company for financial year 2009. The company, which is already contesting additional income tax demands to the tune of nearly Rs 1200 crore for four fiscal years beginning 2005, has stated that it will take legal recourse against the fresh tax demand as well.
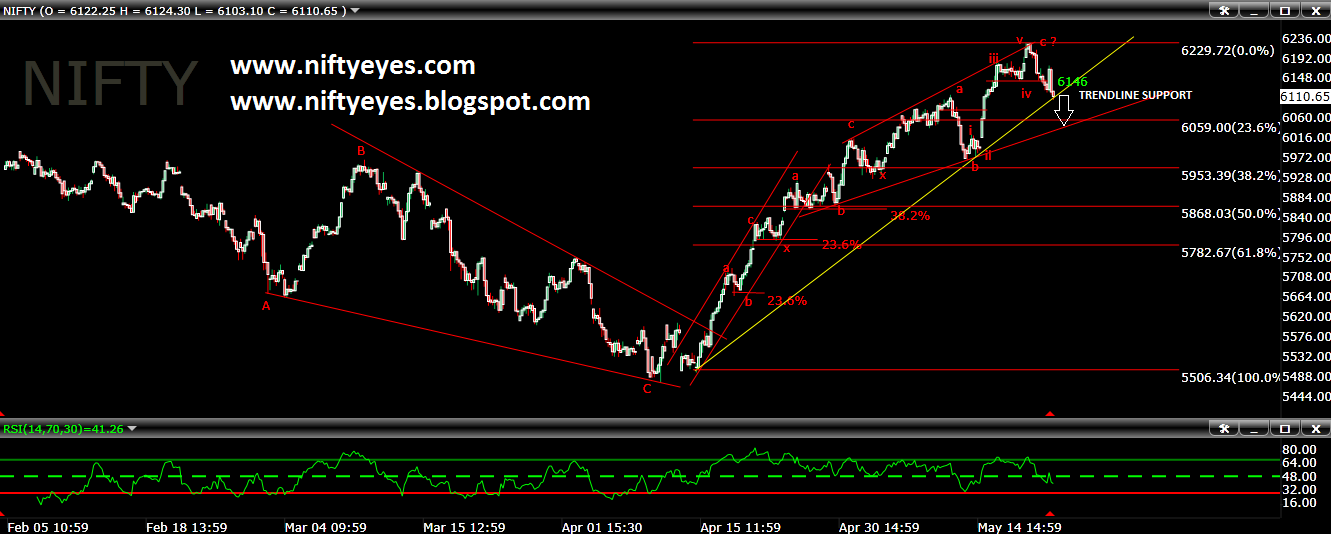
As per Nifty Hourly chart it seems that it has completed triple zig zag complex correction with indicating loosing in momentum. Break below 6140 will indicate that sideways to down trend has been started. Highest open interest in 6200 call may create hurdle for nifty on higher side. According to chart pattern rising trend line will provide resistance on higher side above 6200.
17 May 2013
NIFTY ELLIOTT WAVE SCENARIO
Recommendation- Only Intraday trading is advisable for few days.
16 May 2013
13 May 2013
NIFTY UPDATE FOR 14 MAY
BIGGEST FALL IN 2013
NIFTY X-RAY REPORT FOR 13 MAY


WEEKLY HIGH - 6105 WEEKLY LOW - 5867
5 DMA DAILY - 6046
20 DMA DAILY- 5844

12 May 2013
NIFTY LATEST ELLIOTT WAVE UPDATE 12 MAY 2012
8 May 2013
NIFTY CRUCIAL UPDATE FOR 09 MAY

7 May 2013
NIFTY X- RAY REPORT FOR 08 MAY


Nifty hit three months high today and gave solid gain and closed above 6000 level. A rising trend line support is coming at 5970 level now. As per EOD candle stick pattern Bullish Gap up candlestick pattern has formed on daily chart today which is indicating strong up side trend in short term. As per nifty Relative Strength Indicator (RSI), it is at 68 level and it has come in overbought zone. As per nifty slow stochastic indicator it is placed in overbought zone. The recent price pattern on nifty daily chart had given strong bullish signal from 5477 with increasing RSI towards upside in near term. Nifty has strong resistance near 6080-6103. NIFTY is in buy mode. But momentum indicator is placed in overbought zone and indicating negative divergence.
WEEKLY HIGH - 6050 WEEKLY LOW - 5867
5 DMA DAILY - 5978
20 DMA DAILY- 5763
| Advance / Decline Stocks above / below 50 DMA Breakouts: Bullish / Bearish Stocks gaining / losing >>> 5% Stocks Oversold / Overbought Stocks at 20 day HI / LO Stocks at 52 week HI / LO | 617 / 428 596 / 449 38 / 1 39 / 9 23 / 128 231 / 60 39 / 24 |

For larger view click on chart

6 May 2013
Nifty Update for 07 May
1 May 2013
NIFTY UPDATE
A SHIFT FROM MENTAL ANALYSIS
28 April 2013
NIFTY X-RAY REPORT FOR 29 APRIL 2013 WITH WEEKLY VIEW


Nifty gave a breakout above falling trend line and closed above 5900 psychological level but it fell again below 5900 level next day. AS per EOD candle stick pattern Bearish harami candlestick pattern has formed on daily chart which is indicating reversal in short term trend. As per nifty Relative Strength Indicator (RSI), it is at 61 level and it has turned its face towards downside indicating trend reversal also. As per nifty slow stochastic indicator it is placed in overbought zone. The recent price pattern on nifty daily chart hadd given strong bullish signal from 5477 with increasing RSI towards upside in near term. Nifty has strong resistance near 5971. NIFTY is in buy mode. But momentum indicator is placed in overbought zone so short term reversal may happen.
WEEKLY HIGH - 5924 WEEKLY LOW - 5500
5 DMA DAILY - 5848
20 DMA DAILY- 5674
Stocks above / below 50 DMA Breakouts: Bullish / Bearish Stocks gaining / losing > 5% Stocks Oversold / Overbought Stocks at 20 day HI / LO Stocks at 52 week HI / LO | 405 / 616 16 / 1 16 / 24 24 / 77 111 / 68 35 / 34 |

In short a volatile move is going to happen next week.

Disclamer:-
Futures and Options trading have large potential rewards, but also large potential risk. You must be aware of the risks and be willing to accept them in order to invest in the Futures and Options markets. Don't trade with money that you can't afford to lose. This is neither a solicitation nor an offer to Buy/Sell Futures or Options.
The contents of this site are for general information purposes, only. The strategies/plan discussed above in this thread/site is made by me based on data which is operated and maintained by third parties. However it is tested and proved every attempt has been made to assure accuracy, but it is by me only. We assume no responsibility for errors or omissions. Examples on this site and in the manual are provided for illustrative purposes and should not be construed as investment advice or strategy. The future data manual is for informational purposes only. These predictions/tips are technical , based on charts conditions ONLY. This is only a guideline, the decision has to be taken after logical thinking by you. Technical analyst and astrologist will not be liable for any personal or financial losses or profits.
The information and views in this website & all the services we provide are believed to be reliable, but we do not accept any responsibility (or liability) for errors of fact or opinion. Users have the right to choose the product/s that suits them the most.


20130516234538.png)