AUTOMATED TRADING

AUTOMATED TRADING

20 June 2013

NIFTY UPDATE FOR 21 JUNE

  CHOTA BACHHA SAMAJH KE MUJHKO NA SATAANA RE............ DUBI DUBI DUB DUB...........
ENJOY  BEARS  CHEERS !!!!!!!!!!!!!!!!!!!!
MARKET BIGGEST FALL AFTER 2011.
SINCE SO MANY TIMES I WAS WRITING ABOUT THIS DOWNFALL BUT YOU DID NOT BELIEVE THIS TIME ALSO.
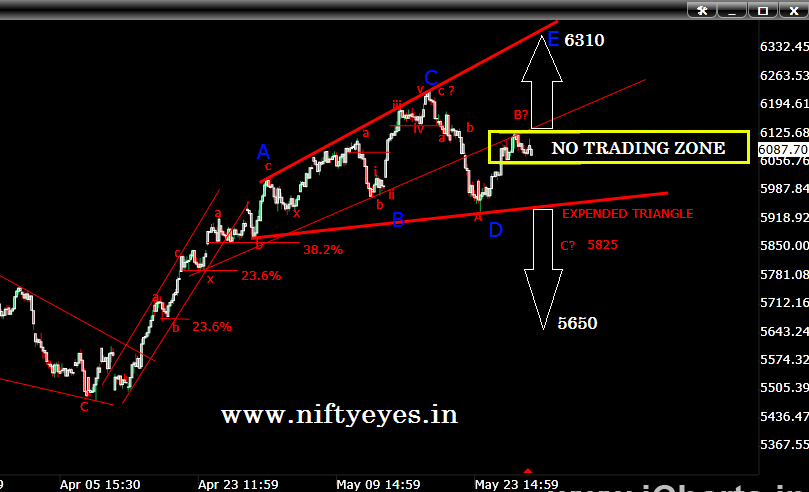
RECENTLY ON 17 TH JUNE JUST THREE DAYS BACK I POSTED THIS CHART SCENARIO. JUST HAVE A LOOK......
5650 CAME TODAY.......
Now what next...........................
Nifty 5700 call option added fresh 4227250 contracts in open interest. Nifty 5600 call added 1955300 fresh contracts in open interest indicating huge call writing has created into the system. FIIs sold index future worth Rupees 1071 crores and open interest increased by 16.2%. Huge fresh short position has been created into the system. FIIs sold shares worth Rs. 2094 crores in cash market today. Earlier bullish island reversal pattern had formed on the nifty chart but today again it formed bearish island pattern. As per nifty weekly chart if nifty break and give a close below 5630 than 5332 is next support on nifty. As I had warned you that upmove is not sustainable and nifty reversed from that level. Over all sentiment is bearish. 5332 is coming soon.
More details to our subscribers.
Join Nifty Eyes trading club and just do double your capital in four months in future market with simple and easy trading system.
Enjoy.........
GOOD LUCK

17 June 2013

NIFTY ELLIOTT WAVE SCENARIO

Nifty fell exactly up to 76.4% retracement level and reversed sharply. But what is the next ? Is the major trend has changed now or still remain in negative. Posting below two chart to understand the possible pattern.
According to my wave count 5884 to 5934 will provide good selling opportunity. This view will be invalid if nifty cross above 5934 level. If nifty cross above 5934 we will post another wave scenario.
click on chart for its larger view.


12 June 2013

NIFTY LATEST PATTERN

S&P CNX NIFTY is trending down for 5 days or in other words , the stock is daily closing at a lower price than previous days close and closed today below 200 day moving average and 61.8% retracement level. Any more closing below 200 and 61.8% level may create speed fall towards 5630. Industrial output growth crawls at 2% in April. Today's high and low will provide further short term direction. A gapup opening above today's high can be bullish but chances are very low. 275 stocks traded today below 50 day moving averages. 61 stocks in BSE 500 index touch 52-week low;Nifty and BSE 500 indices trading below 200 daily moving average. Nifty 5800 call added 2080350 fresh contracts today indicating huge call writing has happen today. Yesterday 5800 call added 1367900 contracts. Total 3448250 contracts added in open interest in last two days, indicating 5800 level will create big obstacle for bulls. Now lets see what happened in today's trade. FIIs sold first time in 4 digit figure in cash market in 2013. Nifty tried to cross 5790 level but failed again and again and closed below 200 level, indicating more pain is due in our market. Nifty weekly chart confirming rising wage pattern. Break below lower trend line of falling wage will create strong bearish momentum. Head and shoulder pattern attracting nifty towards 5600 level.
 

11 June 2013

NIFTY SLIDING TOWARDS 5600

 
Nifty took stop at 200 days moving average 5781. Not a good close for bulls today.
Any two consecutive close below 5781 will drag nifty directly up to lower trend line as drawn in chart below. In our earlier post we wrote about this possible pattern which is shown in the chart below. FIIs exited from all long position in index future till yesterday and today fresh short position made. They sold index future worth Rs.1857.98 crores and open interest increased by 11.5% indicating huge fresh short position created today. FIIs sold such huge amount in a single day first time in 2013. Highly bearish day expected ahead. Nifty may slide up to 5600. Below 5600 Blood Bath.

Just see the weekly chart of Nifty below, since 2012 prices were facing the strong resistance of the multiyear upward sloping trend line and moved lower two times. In last month of May 2013 prices have found resistance of the same trend line for third time and turned on downside as shown in the chart below. Momentum indicator RSI showing the strong negative divergence indicating strong down trend ahead. If RSI break below blue trend line as drawn on RSI as lower trend line, we will see fast downtrend.
We are seeing head and shoulder pattern also on hourly chart which neck line has already broken and predicting target 5477. As long as 5931 is protected no body can stop nifty to fall upto 5600 level.
Nifty 5800 call option added 1367900 fresh contracts in open interest indicating 5800 call has been written today indicating nifty will face resistance above 5800 for tomorrow session.
Join nifty Eyes Trading Club and learn and enjoy profits Click on chart for its larger view.
 

10 June 2013

NIFTY UPDATE FOR 11 JUNE

 The rupee hit a record low against the dollar on Monday, escalating worries about the country's current account deficit and complicating the task for policy makers looking to revive an economy that grew at its slowest in a decade in 2012/13. The finance ministry's chief economic adviser Raghuram Rajan said the rupee's fall was a temporary phenomenon, echoing comments from government leaders, and added the administration was taking measures to tackle the imbalance in the current account. While analysts agree that the rupee has run into a broader dollar rally that is also pressuring other emerging currencies such as the Indonesian rupiah, India's currency is seen as more vulnerable due to the country's high fiscal and current account deficits.
A weaker currency could undermine recent fiscal and economic measures by the government that helped spark a surge in foreign inflows. It also complicates the central bank's campaign to cut interest rates in a country still facing the prospect of losing its investment-grade ratings. "A weak rupee can revive a number of past woes, upset the easing inflation trajectory, raise CAD financing concerns and up the currency risks for offshore borrowers. This might also raise another hurdle for the central bank for cutting rates," said Radhika Rao, an economist with DBS Bank in Singapore. The Reserve Bank of India is next due to review monetary policy on June 17, and many economists and traders expect it to pause in its monetary easing after cutting rates by 25 basis points in each of its past three meetings.
The rupee fell to a record low of 58.17 on Monday, according to the latest available Thomson Reuters data, as the dollar gained on data showing China's economy losing momentum and after a reasonably healthy pace of U.S. job creation renewed expectations the Federal Reserve might curb its asset purchases later this year. The Indian currency is running neck to neck with the Korean won as the worst performer among emerging Asian currencies in the year to date. The tumble comes as the Indian economy appears to have better momentum than it did exactly a year ago when the rupee last hit a record low, but still faces a long road to recovery. The most immediate risk centres around financing the current account deficit. That measure had been expected to have narrowed this year from a record 6.7 percent of gross domestic product in the October-December quarter due to falling prices for gold and oil - the country's two biggest imports. Worries over the current account have been exacerbated by foreign investor net sales of more than $2.5 billion in domestic debt over the previous 12 sessions, spurred by concerns that the weaker rupee would erode returns.
Overseas investors have also been spooked by the prospect of an end to the Fed's quantitative easing, while for bond investors, the surge in U.S. Treasury 10-year yields since early May has reduced the yield differential with Indian debt. Finance ministry officials told Reuters the falling rupee was discussed in a previously scheduled meeting on Monday with market regulators and the central bank. "The FII (foreign institutional investors) capital outflows are likely to continue for next 10-15 days," an official said adding the rupee could touch even 59 against the dollar if the outflows continued. Overseas funds are vital to India's economy as a surge in net foreign buying since 2012 - totalling almost $50 billion in both debt and stocks - has been key in financing the deficit. "The current account deficit is large, which needs large amount of capital inflows. The dependence on short-term debt is resulting in the hammering of the rupee," said Sujan Hajra, chief economist at Anand Rathi Securities.
source:- sify finance
 

NIFTY UPDATE


Selling pressure is coming on high level. FIIs are selling index future continuously and Rupees making new high will give pressure in our Market. Midcap and Small cap index closed on negative note for the first time in last five trading sessions. This shows that along with large cap stocks, now mid cap stocks also participated in the fall. Stocks Declining is more than advancing. These all indicate for strong bearish trend is awaiting in our Indian Market. From medium term perspective Elliott wave theory suggested the start of next leg on downside in the broader market. As long as 5990/6000 is intact on upside bears will be upper hand. Any attempt on the upside will provide the bearish opportunity and prices should move lower towards 5850 or even lower. Positional traders may keep sl at 6000 on closing basis for short side.

4 June 2013

NIFTY MOVING EXACTLY ACCORDING MY TECHNICAL PRIDICTION

Just see when and what i posted about nifty further direction:-
Posted on 20 May 2013
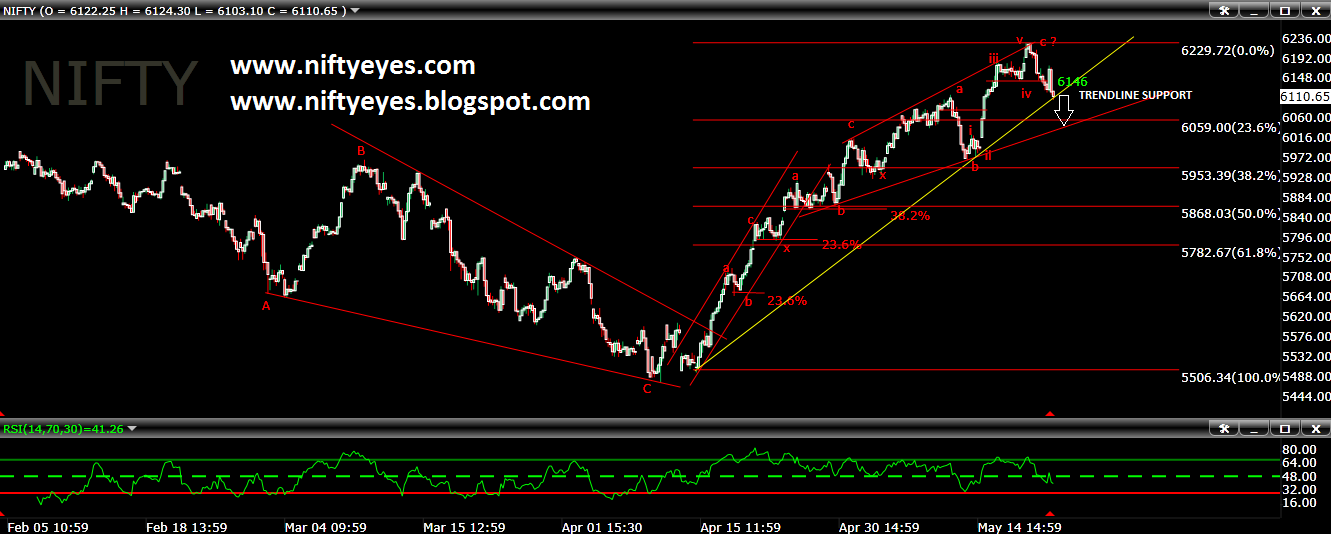
The correction in nifty today seems that nifty has completed its 3rd standard of correction and may move in b-B wave. If this wave count is valid then nifty should fall minimum up to 6059 and 5953 as indicated in the chart below. Below 6140 fresh short position can be created for the above mentioned target with 6229 as stop loss.
chart posted with this analysis,

ON 23 May chart posted

On 27 May chart posted

On 29 May

ON 2nd JUNE

What else clue you want. If you have still doubt my dear friend then listen my advice- please don't trade with your expectation and don't do adventure with your capital. 
For fantastic performance Join Our trading club and enjoy trading tension free. 

2 June 2013

NIFTY LATEST UPDATE AND WEEK AHEAD

We have seen huge volatile session in last week as i have warned you in my Monday's post. In last 15 days we have seen more than 100 points fall three times but two times nifty recovered its losses. Will it recovered this time also ? Lets consider. The situation is little different. FIIs were net buyer in previous two fall but This time FIIs sold index future worth Rs.1827 crores indicating fall will not easily recovered. As per nifty daily chart prices has fallen sharply below 20 days moving averages with supporting momentum indicators. According to nifty hourly chart Expanding triangle trend line support is coming around 5960 level. If this level break nifty may drag towards 5907 level.  Economic news from across the globe will certainly put an impact on  the market's direction. With the International Monetary Fund and the Organization for Economic Co-operation and Development forecasting a weak outlook for China and the European region respectively, global markets are likely to see some weak spells next week.
Trade cautiously. Huge volatile week ahead.


30 May 2013

TOP IS NEAR

Nifty top is very near. The maximum Stretch I am assuming up to 6290-6310. As we are seeing in hourly chart below that it seems that expanded triangle pattern has form. As per chart Analysis it is in its final leg of expansion and  If nifty enter above green trend line and if it close above this trend line as shown in picture below then there will be high possibilities that nifty may jump up to 6290-6310 level. After that a big fall is awaiting in market. And if nifty break below lower thick red trend  line then down move may stretched. In very short tern any slide below 6070 will increase the possibilities for downside. Trade cautiously. Weakness in rupees may flow water on bulls expectation.


WHAT TO DO IN NIFTY NOW

As you are seeing in chart below that it seems expanded triangle pattern formation has prepared on nifty hourly chart. But nifty is trading in very tight range due to concern of weakness in rupees. I would like to keep aside my self for some time from trading. Let the market decide. Nifty is moving in no trading zone.
Trade above 6125 for positional long and Positional short trade below 6050 followed by 5990.
 NO TRADING ZONE BETWEEN 6050-6125. WASHOUT ZONE FOR MARKET. 

26 May 2013

INDIAN MARKET THE WEEK AHEAD

Indian Market Week Ahead: News and International effect :- 
Indian Market expected to remain volatile due to F&O Expiry and GDP data.After five consecutive weeks of gains, Nifty slide 300 points last week and manage to close at 5983 level . 24 stocks was down out of the 30-stock from Sensex group. We may see another red week ahead, as concerns about global economic outlook on the back of some weak data from China will give effect on the sentiment.The market is expected to see some wild swings ahead of expiry of May series derivatives contracts next week. Market mood for most part of the week, may remain cautious as investors will be eyeing on the March quarter GDP data, which will come out on May 31, 2013. In the December 2012 quarter, India saw a GDP growth of 4.5%, significantly dow from a 5.3% rise a quarter earlier.
Some major famous company quarterly results like Cipla, ONGC, Oil India ,Sun Pharma, Hindalco, GAIL India, Power Grid Corporation, REC, Indian Oil Corporation, BPCL and Hindustan Petroleum Corporation, Wockhardt, Neyveli Lignite Corporation, Canara Bank, NMDC and Colgate Palmolive will help to increase the volatility in the market in coming week amid speculation the U.S. Federal Reserve may start unwinding its asset purchase program soon,  and this could set up a weak start for Asian markets on Monday.
Fiis have been net buyer of Rs 18000 crore in the current calender month, this may prevent from a significant direct fall.

Technical effect for the week ahead:- A bearish engulfing pattern has formed on nifty weekly chart clearly indicating in the change of trend. The gravity force of 50 day moving average is attracting nifty price towards 5843 level. The nifty fall took support at 38.2% level last week. As per Nifty daily chart price has given two consecutive close below 20 day moving average giving vote to bears. As per nifty RSI on daily chart is at 49 level and calling more bears.
As per Elliott wave perspective it seems that rising wave pattern is valid on nifty weekly chart attracting price again towards 5670 level. As per nifty Hourly Chart RSI is trying to improve upside with consolidation in price indicating more dip is due in the market. 
In short Market is in sell on rise mode until nifty give a break and close above 6080 level technical level.


 TATA MOTORS weekly chart is given below. Clear rising wave pattern has formed on weekly chart with losing momentum on RSI indicators. Break below lower trend line bear will take TATA MOTORS towards 125 level.

23 May 2013

DON'T LOSE MONEY AND HOPE IN THE MARKET


So many traders would have loosen  their money in the market today. Because definitely you would have heard this time also when most of fake analyst had been talking about 6700+++. These days hundreds of website providing nontechnical tips and recommendation to innocent people. I would like to request to all viewers that be careful with this type of website.  Don't loose money and hope in the market. Where you have lost there you will get only. If your one lac may be 10000 then your 10000 may also be 1 lac. Market have both  the capacity only you need to change your trading style. Yes ! Change your trading style and stop losing money. Actually why this happen because they think that they are smart than market. But in reality market is smarter then them self. Always try to read the market not your expectation. Market doesn't runs on one expectation.  If you know the better idea to trade then definitely you would have applied it. 
Learn the fantastic way of trading and forecasting the market. Be a trading hero. Join NIFTY EYES MULTILEVEL MONEY MAKING CLUB and stop loosing money. Join before your all capital washed out.
Two days back I had boldly written. Just see what I have written:-
I wrote in my previous post that Nifty has completed its 3rd standard of correction and break below 6140 will drag nifty towards 6059 and 5953. Today nifty closed at lower trend line as shown in picture below. Expect nifty kiss 6059 level tomorrow. Bias are negative now until nifty give closing above 6180 level. Nifty is in sell on rise mode. Next few days action will be very important. Be careful with your overnight position.
 Above line was written on 21 May.
On 16 May I wrote keep patience for 6250. Market went very near to our target. After that I gave you indication that market has completed 3rd standard of correction. Now result is just before you. What else you want now. If this information is not enough for you than i will pray OH GOD SAVE INNOCENT PEOPLE FROM LOSING MONEY.

Technical:- Currently nifty has given closing below 20 day moving average after 24 days. RSI is in favor of bears. Any two consecutive close below 20 day moving average may drag nifty towards 5900. Nifty weekly charts rising wage trend line support attracting with negative divergence on RSI  towards 5600 but it will be little early to talk about this level. Pattern is completely sell on rise until nifty give breakout above 6080 level. One should improve stop loss in this type of market so that big rally could acquire if downtrend converted into big rally.
click on chart for its larger view.


JOIN MULTI LEVEL MONEY MAKING CLUB ONLY AT RS.8888 FOR ONE FULL YEAR. OFFER VALID TILL 31 MAY 2012.


FROM 6180 TO 5960 BOLDLY WRITTEN. 
WHAT ELSE ANALYSIS YOU WANT ?

21 May 2013

NIFTY UPDATE

I wrote in my previous post that Nifty has completed its 3rd standard of correction and break below 6140 will drag nifty towards 6059 and 5953. Today nifty closed at lower trend line as shown in picture below. Expect nifty kiss 6059 level tomorrow. Bias are negative now until nifty give closing above 6180 level. Nifty is in sell on rise mode. Next few days action will be very important. Be careful with your overnight position.


JOIN NIFTY EYES MULTILEVEL MONEY MAKING CLUB AND TRADE CONFIDENTLY AND LEARN ADVANCE TECHNICAL ANALYSIS AND BE A TRADING HERO

20 May 2013

NIFTY ELLIOTT WAVE CURRENT UPDATE

As I wrote in my previous post that nifty may correct. The correction in nifty today seems that nifty has completed its 3rd standard of correction and may move in b-B wave. If this wave count is valid then nifty should fall minimum up to 6059 and 5953 as indicated in the chart below. Below 6140 fresh short position can be created for the above mentioned target with 6229 as stop loss. Nifty is making higher high and higher low formation. Bias are still positive until unless nifty break and close below 6140 level. Bank nifty has nature to give indication of reversal in trend. As bank nifty has corrected much than nifty today supporting this view.
Traders should be alert at current situation towards long side.
CLICK ON CHART FOR ITS LARGER VIEW


19 May 2013

INDIAN STOCK MARKET WEEK AHEAD

 Week Ahead: Quarterly results will set the trend; Some profit booking is expected in the week ahead.
​Nifty gained consecutive five weeks, as the momentum indicators are showing overbought zone therefore the Indian stock market may spend time in some consolidation next week. Movements are likely to be a bit range bound in next week, although a few front line stocks are expected to see some buying amid consolidation in index. Quarterly results from top companies, including State Bank of India, Oil India, Tech Mahindra, Larsen & Toubro, BHEL, Tata Steel and JSW Steel will give impact on direction of Indian market next week.
Adani Enterprises, Apollo Hospitals Enterprises, Divi's Laboratories, IFCI, Thermax, Hindustan Copper, Welcorp, TV Today, Dish TV India, Jet Airways and Spice Jet are among the other companies that will announce their quarter results next week.
We have seen heavy buying by Foreign Institutional Investors in previous five weeks  which contributes significantly to the market's gains last week, The U.S. markets closed on a high  on Friday (17 May) on the back of some impressive economic data, may help the Asian market start with positive note on Monday.
IT bellwether Infosys will be in focus following the Income Tax department slapping a fresh tax demand of Rs 582 crore on the company for financial year 2009. The company, which is already contesting additional income tax demands to the tune of nearly Rs 1200 crore for four fiscal years beginning 2005, has stated that it will take legal recourse against the fresh tax demand as well.
As per Nifty Hourly chart it seems that it has completed triple zig zag complex correction with indicating loosing in momentum. Break below 6140 will indicate that sideways to down trend has been started. Highest open interest in 6200 call may create hurdle for nifty on higher side. According to chart pattern rising trend line will provide resistance on higher side above 6200.


Disclamer:-

Futures and Options trading have large potential rewards, but also large potential risk. You must be aware of the risks and be willing to accept them in order to invest in the Futures and Options markets. Don't trade with money that you can't afford to lose. This is neither a solicitation nor an offer to Buy/Sell Futures or Options.

The contents of this site are for general information purposes, only. The strategies/plan discussed above in this thread/site is made by me based on data which is operated and maintained by third parties. However it is tested and proved every attempt has been made to assure accuracy, but it is by me only. We assume no responsibility for errors or omissions. Examples on this site and in the manual are provided for illustrative purposes and should not be construed as investment advice or strategy. The future data manual is for informational purposes only. These predictions/tips are technical , based on charts conditions ONLY. This is only a guideline, the decision has to be taken after logical thinking by you. Technical analyst and astrologist will not be liable for any personal or financial losses or profits.

The information and views in this website & all the services we provide are believed to be reliable, but we do not accept any responsibility (or liability) for errors of fact or opinion. Users have the right to choose the product/s that suits them the most.

By your act of reading this independent and individual market research, you fully and explicitly agree that Rajesh Singh or My website (www.niftyeyes.blogspot.in/www.niftyeyes.in) will not be held liable or responsible for any decisions you make regarding any information discussed herein. Take a proper advice from a certified adviser before invest in future and option market.