AUTOMATED TRADING

AUTOMATED TRADING

15 March 2012


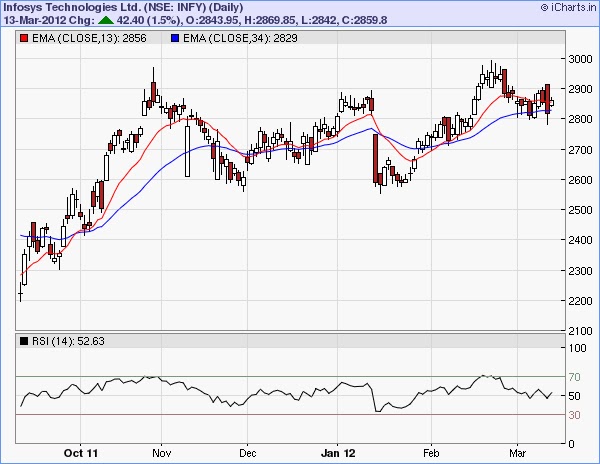
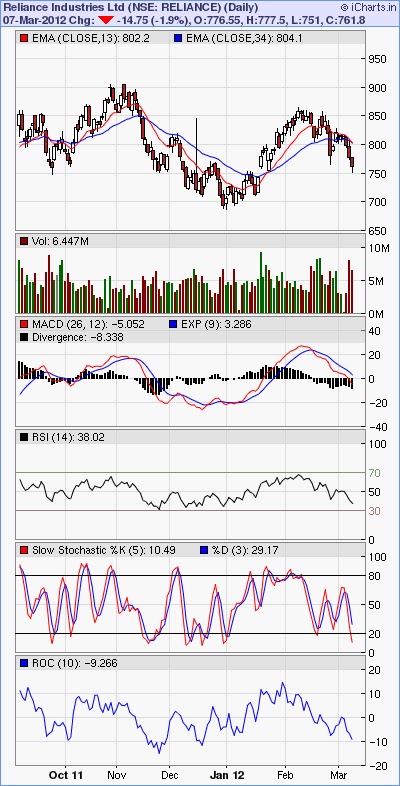
NIFTY X-RAY REPORT FOR 160MARCH
Nifty closed at 5380.40 -83.40 -1.53%
5300 CE OI DECREASED -255500 TOTAL OI 2634050
5400 CE OI ADDED +430650  TOTAL OI 3910050
5500 CE OI ADDED +1160050 TOTAL OI 6142700
5300 PE OI DECREASED -188350 TOTAL 6277650
5400 PE OI  ADDED +21400 TOTAL OI 4621800
5500 PE OI  DECREASED -535100 TOTAL OI  3043650

As i told you huge open interest buildup was seen in 5600 CE yesterday and watch the level of 5500 level carefylly. nifty closed with significant declines today.All sectoral indices closed in red. consumer durebles, realty and, banking were biggest loser . Market bredth was negetive  with advances at 394 againest declines of 961 on NSE. Top nifty gainer was HUL today. Credit policy rate action hinged on inflation and crude oil price may spur inflation with fiscal slippage additing to inflation. 
Avoid aggressive buy on index on friday and wait for the volatility to die down. As per option open interest data 5300 level should act as strong support zone for nifty. Nifty immidiate support at 5368 level.Watch this on friday carefully. Huge open interest buildup seen in 5500 ce today. FII activity in equity market is +156.02cr. and -502.91 cr in future market. Fii are not selling in  cash market. They are selling in future market so that they grab opportunity of news base volatility.AS per Fii activity dont expect any panic like situation. Long term players grab opportunity of dip  of 5200 -5100 level.
A long outside bar bearish candlestick has formed on EOD charts. prices has just closed at 13 EMA. After breaching 5300 level we may kiss 5050 level very soon. BUt all eyes are stick with our Finance ministers on friday. If Fm manage to fullfill the expection of market  then expect a blasting rally till 5640-5755, now suppose that if not manage to fullfill the expection of market than expect a sharp fall to 5150-5050 without working any technical support. 

14 March 2012

NIFTY X-RAY REPORT FOR 15 MARCH

NIFTY X-RAY REPORT FOR 15 MARCH
NIFTY CLOSED AT 5463.90  +34.40=0.063% FUTURE PREMIUM AT +42.20
5400 CE OI DECREASED -240000 CONTRACTS TOTAL OI 3533550
5500 CE OI DECREASED -91300   CONTRACTS TOTAL OI 4984950
5600 CE OI ADDED          +741000 CONTRACTS TOTAL OI 6338650
5400 PE OI ADDED          +285950 CONTRACTS TOTAL OI 5011700
5500 PE OI ADDED          +639650 CONTRACTS TOTAL OI 360600
5600 PE OI ADDED          +180050 CONTRACTS TOTAL OI 1496750
The markets closed with moderate gains today with banking and capital goods being the best performers. Power, FMCG and auto, too, made significant gains while realty and IT tried to pull the indices down. The Sensex closed at 17919, up 106 points from its previous close, and the Nifty shut shop at 5464, up 34 points. The CNX Midcap index closed with 0.7% gain while the BSE Smallcap index was down 0.3% in today's trade. The market breadth was negative with advances at 653 against declines of 791 on the NSE. The top Nifty gainers were PNB, BPCL, NTPC and Axis Bank while the biggest losers included TCS, JP Associates, Reliance Communications and Tata Steel.
As per option open interest data 5500 PE  and 5600 CE added higest open interest, indicating market will face resistance around 5600 level in near future.I told you yesterday that 5440 level will break on only gap up move.  nifty maintain today 5440 level. Market showed uncertainitydue to  RBI credict policy meet tomorrow. both 5600CE  and 5500 PE have been written today. Carefully watch of 5500 level of nifty future tomorrow.High volatility is expected next two days. Any break of 5440 spot nifty level this time  bears  may drag nifty upto 5200 level. tomorrow session will be considerable.
==================================================================================
                                   HIGH                           LOW                  CLOSE
LAST                        5499.40                          5437.80               5463.90
PREV                       5438.65                          5390.80               5429.50
LWEEK                   5382.05                          5171.45               5333.55
==========================================================
SWING INDICATORES
5D- BUY AT 5430 REVERSAL 5171
10D- BUY AT 5464 REVERSAL 5171
20D-SELL ST 5222 REVERSAL 5630
==========================================================
INTRADAY SUPPORT AND RESISTANCE
S2-5405/S1-5434/PIVOT-5667/R1-5496/R2-5528
==========================================================
MOVING AVRAGES
5D-5361/20D-5406/50D-5194/200D-5168
==========================================================
52 WEEK HIGH---------5944.45
52 WEEK LOW----------4531.15 

SAIL

As per Relative Strength Indicator (RSI), Steel Authority of India Ltd. was in over sold level. However, recent price moves on 13/03/2012 indicates trend reversal and stock may rise in near future. Stock - Steel Authority of India Ltd. has moved above 20 days Exponential Moving Average after 12 days on 13/03/2012
Bullish gap up Candlestick pattern was formed by Steel Authority of India Ltd. on 13/03/2012
Stock has jumped by more than 10% in last two weeks. Stock has jumped by more than 25% in last three Month..
Share has hit two week high on 13/03/2012
Buy sail at 102 target 108-112 stoploss 99.50

13 March 2012

INFY

INFOSYS HAS FORMED A BULLISH HARAMI PATTERN ON CHARTS. AS PER RSI IT IS IN BUY MODE. STOCK MAY RISE IN NEAR FUTURE. BUY THIS STOCK ABOVE 2860 FOR THE TARGET OF 2960. KEEP STOPLOSS AT 2828 ON CLOSING BASIS.

NIFTY X-RAY REPORT FOR 14 MARCH

NIFTY X-RAY REPORT FOR 14 MARCH
NIFTY CLOSED AT 5429.50
5300 CE OI DECREASED -308100 CONTRACTS  TOTAL OI 3032500
5400 CE OI DECREASED -462350 CONTRACTS TOTAL OI 3834750
5500 CE OI DECREASED -61000 CONTRACTS TOTAL OI 5135150
5300 PE OI ADDED 354350 CONTRACTS TOTAL OI 5811450
5400 PE OI ADDED 941000 CONTRACTS TOTAL OI 4782000
5500 PE OI ADDED 205050 CONTRACTS TOTAL OI 2989700
=======================================================
Bullish engulfing outside bar candle sticks pattern formed in nifty EOD charts.As per RSI and slow stochastic nifty is in strong buy mode. Nifty has given closing at 5429.50 after 10 days. AS per option open interest data huge put writing has been seen in 5400 PE which is higest open interest addition today. These option data was not clear yesterday. today it has given clear signal even 5500 PE were writing today. All data indicating sharp up move for next trading days also. nifty is facing strong resistance around 5440. Expect it will break in gap up only. Only sustaining above 5440 will confirm nifty next move.I expect nifty in near term 5540.
============================================================
ADVANCE/ DECLINE==755/361
                              HIGH               LOW                 CLOSE
LAST                    5438.65            5390.80              5429.50
PREV                    5421.90            5327.30              5359.50
LWEEK                5382.05            5175.45              5333.55
==========================================
SWING INDICATORS
5D-BUY @  5430  REVERSAL 5171
10D- SELL @ 5281 REVERSAL 5459
20D- SELL @ 5222 REVERSAL 5630
==========================================
INTRADAY SUPPORT AND RESISTANCE
S2-5371,S1-5400, PIVOT-5419,R1-5448,R2-5467
==========================================
MOVING AVRAGES
5D-5313/20D-5402/50D-5177/200D-5168
HIGEST CLOSE
5D-5429.50/10D-5429.50/20D-5607
LOWEST CLOSE
5D-5220.45/10D-5220.45/20D-5220.45

SHORT TERM VIEWS ON BHEL, SAIL

 BHEL
 BUY BHEL ABOVE 292.50 TARGET 305 -308 STOPLOSS 280.
STOCK IS BULLISH ON VERY SHORT TERM
SAIL
 BUY SAIL  ABOVE 99.50 TARGET 108 STOPLOSS AT 94

NIFTY X-RAY REPORT FOR 13 MARCH

NIFTY X -RAY REPORT FOR 13 MARCH
5200 CE OI DECREASED -87150 TOTAL OI 2916600
5300 CE OI DECREASED -102900 TOTAL OI 3365100
5400 CE OI ADDED +266700 TOTAL OI 4471050
5200 PE OI ADDED 322350 TOTAL OI 7566050
5300 PE OI DECREASED -493500 TOTAL OI 5567700
5400 PE OI ADDED 512250 TOTAL OI 3926300
==============================================
As per current option open interest data this highly unpredictable situation in the market now.  Yesterday market open gap up but didnot sustained above 5400 level.Yesterday profit booking seen in nifty future. 5400 CE and 5400PE both were written yesterday, also unwinding seen in 5300 PE  yesterday. Highly unpredictable  situation. but one indication is  yesterday 5400 PE writting is just double than 5400 CE. FII bought 1298.64 cr in cash market yesterday. In current situation  for bulls market has to close above 5440 level, and for bears market has to close below 5280 level. One more thing  if market does not close above 5440 in next two trading session bears may drag nifty towards 5050 level. Short term opprtunist traders keep remember this words.Trade in minmum quantity.   

9 March 2012

NIFTY X-RAY REPORT FOR 11 MARCH

NIFTY X-RAY REPORT FOR 11 MARCH
NIFTY closed at 5333.55+2.17%
5200PE OI  ADDED 650750 CONTRACTS TOTAL 7474700
5300 PE OI ADDED 1290350 CONTRACTS TOTAL 6164250
5400 PE OI ADDED 206150 CONTRACTS TOTAL 3482150
5300CE OI DECREASED -331650 CONTRACTS TOTAL 3519450
5400CE OI DECREASED -6200 CONTRACTS TOTAL 4326000
5500CE OI DECREASED -137100 CONTRACTS TOTAL 4974700
===========================================================
As per option OI data huge open interest addition seen in 5300 PE. and we have seen in deduction in 5200,5300, 5400 and 5500 CE, indicating clearly that PUTS have been written today. As I have all ready given indication on wednessday that market may reverse. Idont know howmany of you believed or not. It has given smart recovery from 5200DMA. Rate cuts by 75BPS to 4.75% from 5.5% by RBI can boost up this rally on monday, and any closing above 5440 we may kiss once again 5600 level very soon. A smell of cooking by RBI from special source had come during trading our today. I have all ready given recomendation today to my all paid subscribers to buy nifty as much as you can . outside bar bullish candal has perform on daily charts. As I told you yesterday as per fast and slow stochastic nifty was in oversold zone.Today RSI and STOCHASTIC has turned up, indicating a strong upmove. nifty has given closing at just above 13EMA. Watch the sustaining move above 5400 on monday. if sustain we may see a smart rally. Banking, finance, reallty, auto will boost niftyup.
FII has bought 1284.65cr today in cash market.
=================================================================================
                                    HIGH                  LOW              CLOSE
LAST                          5342                     5291                5333.55
PREV                         5243.85                5171.45           5220.45
LWEEK                     5458.80                5268.15           5359.35
===========================================================
SWING INDICATOR
   5D  SELL @ 5429 REVERSAL 5393
10D SELL @ 5281 REVERSAL 5521
20D SELL @ 5222 REVERSAL 5630
================================================
INTRADAY SUPPORT AND RESISTANCE
S2-5271/S1-5302/PIVOT-5322.45/R1-5353/R2-5373
=================================================
MOVING AVRAGES
5D-5359/10D-5429/20D-5607
HIGEST CLOSE
5D-5359/10D-5429/20D-5607
LOWEST CLOSE
5D-5220/10D-5220/20D-5220

8 March 2012

NIFTY X- RAY REPORT FOR 09 MARCH

NIFTY X-RAY REPORT FOR 09 MARCH
Nifty closed at 5220.45(-0.04%)
Advance/Decline==378/728
5200 CE OI ADDED 526150 CONTRACTS TOTAL 3316350
5300 CE OI ADDED 890600 CONTRACTS TOTAL 4032350
5200 PE OI ADDED 45600 CONTRACTS   TOTAL 7584850
5300 PE OI SHADED -211350 CONTRACTS TOTAL 5414400
=======================================================
Nifty has given lowest close after 12 trading session.5169 which is 200 DMA acted as a strong support zone, and we saw  strong recovery from that level. As per fast and slow stochastic nifty was in oversold zone. 5300CE added higest open interest on call side, even 5200CE seen writting yesterday. but higest open interest in 5200 pe not let the nifty fall too much. It took support at 200 DMA and recovered almost 55 points from that level. FII sold 28305 contract in nifty future  worth 742 crores and open interest decreasingby 18059 contracts indicating profit booking on short side on wednesday. I have alerted you on wednesday during trading hour that nifty may take reverse from 5150 level. Nifty is tecnically sell mode. All world indices supporting nifty to recover from 200 DMA. Untill unless nifty given close above 5420 it will not come in strong buy mode. any close above 5420 this time nifty may touch its previous high.
                            HIGH        LOW          CLOSE
LAST                  5243.85      5171.45       5220.45
PREV                 5382.05      5206.40        5222.40
L.WEEK            5458.80      5265.15        5359.35
==================================================================
SWING INDICATORES
5D-  SELL @ 5429 REVERSAL 5393
10D-SELL @5281 REVERSAL 5537
20D-SELL @ 5222 REVERSAL 5630
==================================================================
As per Relative Strength Indicator (RSI), Cipla Ltd. is in over sold level. However, recent price moves on 07/03/2012 indicates trend reversal and stock may rise in near future.This was done with jump in volume. Which is another indicator supporting the counter trend. This stock is in short term down trend. A Bullish harami Candlestick pattern was formed by Cipla Ltd. on 07/03/2012 with rise in volume. Prior to pattern formation this share was in downtrend. Share has hit three months low on 07/03/2012
As per slow stochastic  and rsi stock is in over sold range. traders may book frofit from long side and reverse trade.Buy this stock for the target of 325 and keep stoploss at 302.

HCL TECHNOLOGIES.LTD.

A Bullish engulfing Candlestick pattern has formed by HCL Technologies Ltd. on 07/03/2012 with rise in volume. Stock has jumped by more than 25% in last three Month.. Share has hit two week high on 07/03/2012
As per RSI , HCL Technologies Ltd. is in STRONG BUY ZONE territory with a value of 70.0318. buy this stock at current price level for the target of 520-525. keep a stoploss at 482.

ITC

Doji Candlestick pattern has formed by I T C Ltd. on 07/03/2012 and Bearish harami Candlestick pattern has formed by I T C Ltd. on 07/03/2012. I T C Ltd. has moved below 15 days Simple Moving Average after 11 days on 02/03/2012
Stock - I T C Ltd. has moved below 20 days Exponential Moving Average after 10 days on 02/03/2012
As per Rsi Indicator , I T C Ltd. has given negetive divergence on eod charts. However, recent price moves on 01/03/2012 indicates trend reversal and stock may more fall / correct in near future. Short this stocks below 206 target 195-190. stoploss 212.


RELIANCE VIEWS

Few days back i told you, short reliance at 800 and we gave target of 875. Reliance Industries Ltd. has broken down support of 875, as defined by Bollinger bands, with good volume on 07/03/2012. This could mean a down move is imminent. This stock is in short term down trend.
Share has hit one month low on 07/03/2012. Short traders book profit and reverse your tarde.
As per fast and slow stochastic, Reliance Industries Ltd. is in over sold range with a value of 10.1504. Reliance Industries Ltd. share price is down along with rise in volume on 06/03/2012 . This signals a downward trend. But it has recoverd from 750 level which is strong support zone. momentum traders may buy Reliance at 760 target 800.

6 March 2012

NIFTY X-RAY REPORT FOR 07 MARCH

NIFTY X-RAY REPORT FOR 07 MARCH
NIFTY CLOSED AT 5222.40  -1.10%
5000CE OI ADDED 10100 CONTRACTS TOTAL OI -1362300
5100CE OI ADDED 174650 CONTRACTS TOTAL OI-1089300
5200CE OI ADDED 314450 CONTRACTS TOTAL OI-2744700
5300CE OI ADDED 426400 CONTRACTS TOTAL OI- 3189350
5000PE OI ADDED 1373100 CONTRACTS TOTAL OI -6448650
5100PE OI ADDED 321800 CONTRACTS TOTAL OI-5088550
5200PE OI ADDED -59600 CONTRACTS TOTAL OI-7927450
5300PE OI ADDED 6188700 CONTRACTS TOTAL OI- 288100
============================================================
AS I TOLD YOU YESTERDAY, TODAY WOULD BE A VERY VOLATILE DAY AND I TOLD YOU ALSO THAT ACCORDING TO OI DATA TRADING RANGE WILL BE BETWEEN 5200-5300. I TOLD YOU ALSO THAT ANY BREAK OF 5300 LEVEL NIFTY MAY DRAG MINIMUM 200 POINTS EITHER SIDE.TODAY ALL PICTURE HAS BEEN CHANGED. HIGEST OPEN INTEREST SEEN IN 5200 CE AND HIGEST OPEN INTEREST SEEN IN 5000PE. CLEARLY INDICATING  NIFTY MAY FALL UPTO 5060-5080 LEVEL IN COMING DAYS. ALL SHORT TRADERS CAN BOOK PROFIT IN NIFTY AT THAT LEVEL. AND A SHARP BOUNCE BACK IS EXPECTED FROM THAT LEVEL. ANY BAD GLOBAL TREND MAY NIFTY DRAG TO THIS LEVEL.
====================================================================================
FII/DII TURNOVER
FII -241.22/ DII+179.91
ADVANCE/DECLINE======314/789
                                 HIGH                     LOW                     CLOSE
LAST                       5382                        5206                       5222
PREV                      5344                        5265                       5280
L.WEEK                 5458                        5268                       5359
===================================================================
SWING INDICATOR
5D- DOWN 5222  REVERSAL  5459
10D-DOWN 5281 REVERSAL   5630
20D- DOWN 5222 REVERSAL  5630
====================================================================
INTRADAY SUPPORT AND RESISTANCE
S2-5094/S1-5158/ PIVOT-5270/R1-5334/R2-5445
=====================================================================
MOVING AVRAGES
5D-5317/20D-5410/50D-5128/200D-5170
HIGEST CLOSE
5D-5385/10D-5505/20D-5607
LOWEST CLOSE
5D-5222/10D-5222/20D-5222

5 March 2012

NIFTY X-RAY REPORT FOR 06 MARCH

NIFTY X-RAY REPORT FOR 06 MARCH
NIFTY CLOSED AT 5280.35(-1.47%)
5200 PE OI ADDED 996150 CONTRACT TOTAL OI-8424350
5300 PE OI ADDED 348750 CONTRACT TOTAL OI-2849500
5400PE OI ADDED 175650 CONTRACT TOTAL OI-3850000
======================================================
5200 CE OI ADDED 381950 CONTRACT TOTAL OI -2471400
5300 CE OI ADDED 8071700 CONTRACT TOTAL OI -2849500
5400 CE OI ADDED 488900 CONTRACT TOTAL OI-3683400
ADVANCE/DECLINE=====370/742
AS I told you earlier that market is playing see saw between 5300 -5400. I told you also there is minimum 200 points rally is confirm after breaking 5300 or 5400. today higest open interest addition seen in 5300 call and 5200 put. indicating next trading range between 5200 to 5300. but due to election result tomorrow we expect highly volatile trading session either side. Any significant event on the international front could also have an impact on the markets. best stratagy in current time is wait and watch. On the other hand, risky takers can adopt the ‘straddle option’ strategy, which will benefit them if the markets swing in either side. As per option open interest data Nifty will face  first support  at 5210 and the second one is at 5150. On the other side, the first resistance is at 5440 and the second is at 5610.
                          HIGH              LOW           CLOSE
LAST                5344.50            5265.70         5280.35
PREV               5392.55            5315               5359
LWEEK           5458.80            5265               5359
====================================================
SWING INDICATORS
5D- DOWN    5429   REVERSAL        5459
10D- DOWN   5281  REVERSAL        5630
20D-UP           4850   REVERSAL        5266
====================================================
INTRADAY SUPPORT AND RESISTANCE
S2-5218/S1-5249/PIVOT-5296/R1-5328/R2-5375
====================================================
MOVING AVRAGES
5D-5349/20D-5417/50D-5118/200D-5172
HIGEST CLOSE
5D-5385/10D-5607/20D-5607
LOWEST CLOSE
5D-5280/10D-5280/20D-5280

2 March 2012

RELIANCE VIEWS

NO TRADING ZONE BETWEEN 800-821. THERE IS A BIG TRADING OPPORTUNITY BELOW 800 TARGET 775 STOPLOSS 820 OR BUY ABOVE 821 TARGET 860 STOPLOSS 800 SPOT PRICE. TILL THAN WATCH CAREFULLY.

1 March 2012

NIFTY X-RAY REPORT FOR 02 MARCH
NIFTY CLOSED AT 5339.75= -0.90%
NIFTY FUTURE CLOSED AT 5390.75 -0.90% OI DN 1.76%
ADVANCE/DECLINE                    408/693
======================================================
NIFTY 5200CE OI ADDED 73150 TOTAL = 2130950
NIFTY 5300CE OI ADDED 408400 TOTAL = 2080000
NIFTY 5400CE OI ADDED 760900 TOTAL = 3231500
NIFTY 5200PE OI REDUCED -65300 TOTAL=7521600
NIFTY 5300PE OI ADDED 369000 TOTAL= 6578200
NIFTY 5400PE OI ADDED 158850 TOTAL=4017100
======================================================
I TOLD YOU YESTERDAY UNTILL UNLESS NIFTY CLOSED ABOVE 5440 BULL CANNOT BE COME IN POWER. I ALSO TOLD EXPECT VOLATILITY. ACCORDING TO OI DATA THE PICTURE HAS CHANGE TODAY.5400 AND 5300CE ADDED HUGE OPEN INTEREST . CALL WRITTERS WERE AGGRESIVE TODAY. 5300 PUT ALSO ADDED HUGE OI. INDICATING VOLATILITY AROUND 5300 LEVEL FOR SOME MORE DAYS.BUT ANY  SINGLE CLOSE BELOW 5300 NIFTY THIS TIME DRAG TO 5150 LEVEL VERY SOON. AFTER TWO MONTH FII FIGURE WAS SEEN IN SELL TODAY . THEY SOLD 126.52 CRORE TODAY. YESTERDAY FII SOLD MORE THAN 6000 CONTRACT I NIFTY FUTURE. WEEKLY CHART TREND LINE SUPPORT IS COMING AT AROUND 5100 LEVEL. ANY ONE SIDED POSSITION MAY BE RISKY. EXPECT VOLATILITY TILL NEXT ONE MORE WEEK.
                                   HIGH            LOW             CLOSE
LAST                         5372               5297                5339
PREV                        5458               5352                 5385
L WEEK                   5629               5405                 5429
==================================================
SWING INDICATION
5DAYS    ----SELL   5429           REVERSAL---5521
10DAYS------ SELL  5281           REVERSAL---5630
20DAYS------ BUY   4850            REVERSAL ---5226
===================================================
INTRADAY SUPPORT AND RESISTANCE
S2-5261/ S1-5300/PIVOT-5336/R1-5375/R2-5411
====================================================
HIGEST CLOSE 5D-5429/10D-5607/20D-5607
LOWEST CLOSE-5D-5281/10D-5281/20D-5269
====================================================
NIFTY FUTURE MOVING AVRAGES
5DAYS-  5411 SELL
10DAYS-5503 SELL
20DAYS-5462 SELL
50DAYS- 5139 -BUY
100DAYS-5068 BUY
200 DAYS- 5164 BUY
======================================================
BEARS WERE WAITING FOR FIGHT WITH BULLS AT THE 5440 LEVEL. ANY CLOSE BELOW 5300 THIS TIME NIFTY MAY DRAG TO 5100-5050 VERY SOON. NIFTY ON WEEKLY CHARTS TREND LINE SUPPORT AT 5100 LEVEL. YESTERDAY SHORT SEEN IN NIFTY FUTURE BY FII. SHORT NIFTY FOR THE TARGET OF 5100.

Disclamer:-

Futures and Options trading have large potential rewards, but also large potential risk. You must be aware of the risks and be willing to accept them in order to invest in the Futures and Options markets. Don't trade with money that you can't afford to lose. This is neither a solicitation nor an offer to Buy/Sell Futures or Options.

The contents of this site are for general information purposes, only. The strategies/plan discussed above in this thread/site is made by me based on data which is operated and maintained by third parties. However it is tested and proved every attempt has been made to assure accuracy, but it is by me only. We assume no responsibility for errors or omissions. Examples on this site and in the manual are provided for illustrative purposes and should not be construed as investment advice or strategy. The future data manual is for informational purposes only. These predictions/tips are technical , based on charts conditions ONLY. This is only a guideline, the decision has to be taken after logical thinking by you. Technical analyst and astrologist will not be liable for any personal or financial losses or profits.

The information and views in this website & all the services we provide are believed to be reliable, but we do not accept any responsibility (or liability) for errors of fact or opinion. Users have the right to choose the product/s that suits them the most.

By your act of reading this independent and individual market research, you fully and explicitly agree that Rajesh Singh or My website (www.niftyeyes.blogspot.in/www.niftyeyes.in) will not be held liable or responsible for any decisions you make regarding any information discussed herein. Take a proper advice from a certified adviser before invest in future and option market.