AUTOMATED TRADING

AUTOMATED TRADING

30 December 2012

There could be only 5 condition in the market.....

Condition 1... Market move up.
Condition 2... Market moves down.
Condition 3... Market move up and start falling down.
Condition 4... Market move down and start rising up.
Condition 5... Market remain flat and moves in tight range.
In all these condition Intraday setup is stealing good trading opportunity everyday. Any how it will give you atleast one trade opportunity in a day along with, it will keep you away also from unnecessary trading.
Good luck.  

NIFTY X- RAY REPORT FOR 31 DEC

Fiscal cliff is on the way so volatility will remain live for next few week. Nifty is facing resistance on the falling  trend line as shown in chart below. A bullish harami candlestick pattern has formed on nifty EOD chart which is bullish signal for the coming days. But as per chart pattern it is confirmed that nifty is in its forth wave therefore volatility may remain continue till it complete its time and price correction. As per Elliott wave theory nifty may correct till 5750 also in this wave. Long term lower rising trend line is also coming near 5740 so touching of this level in jan series can't rule out. After that a jump to 6200 is on the card. Forth wave trading is really will be difficult for aggressive traders. Nifty is trading in a triangle pattern and 5910 is resistance of this triangle and it should be break this level for next up move.
According to option open interest data 5800 put and 6000 call has highest open interest data indicating the possible volatile range of nifty. Any change in OI data may give fresh indication of nifty.
Suggestion - trade Intraday till next two week otherwise choppy market may chop up your profit. 5923 and 5946 is current resistance and 5893 and 5870 is current support on the chart.
Good luck.


29 December 2012

FISCAL CLIFF EXPLAINED

Written by:- Thomas kenny
“Fiscal cliff” is the popular shorthand term used to describe the conundrum that the U.S. government will face at the end of 2012, when the terms of the Budget Control Act of 2011 are scheduled to go into effect.
Among the laws set to change at midnight on December 31, 2012, are the end of last year’s temporary payroll tax cuts (resulting in a 2% tax increase for workers), the end of certain tax breaks for businesses, shifts in the alternative minimum tax that would take a larger bite, a rollback of the "Bush tax cuts" from 2001-2003, and the beginning of taxes related to President Obama’s health care law. At the same time, the spending cuts agreed upon as part of the debt ceiling deal of 2011 will begin to go into effect. According to Barron's, over 1,000 government programs - including the defense budget and Medicare are in line for "deep, automatic cuts."
In dealing with the fiscal cliff, U.S. lawmakers have a choice among three options, none of which are particularly attractive:
They can let the current policy scheduled for the beginning of 2013 – which features a number of tax increases and spending cuts that are expected to weigh heavily on growth and possibly drive the economy back into a recession – go into effect. The plus side: the deficit, as a percentage of GDP, would be cut in half.
They can cancel some or all of the scheduled tax increases and spending cuts, which would add to the deficit and increase the odds that the United States could face a crisis similar to that which is occurring in Europe. The flip side of this, of course, is that the United States' debt will continue to grow.
They could take a middle course, opting for an approach that would address the budget issues to a limited extent, but that would have a more modest impact on growth.
Can a Compromise be Reached?
The oncoming fiscal cliff is a concern for investors since the highly partisan nature of the current political environment could make a compromise difficult to reach. This problem isn’t new, after all: lawmakers have had over a year to address this issue, but Congress – mired in political gridlock – has largely put off the search for a solution rather than seeking to solve the problem directly. In general, Republicans want to cut spending and avoid raising taxes, while Democrats are looking for a combination of spending cuts and tax increases. Although both parties want to avoid the fiscal cliff, compromise is seen as being difficult to achieve – particularly in an election year. Currently, it appears that a meaningful deal won't be reached until after the December 31 deadline.
The most likely outcome is another set of stop-gap measures that would delay a more permanent policy change. Still, the non-partisan Congressional Budget Office (CBO) estimates that if Congress takes the middle ground – extending the Bush-era tax cuts but cancelling the automatic spending cuts – the result, in the short term, would be modest growth but no major economic hit.
Possible Effects of the Fiscal Cliff
If the current laws slated for 2013 went into effect permanently, the impact on the economy would be dramatic. While the combination of higher taxes and spending cuts would reduce the deficit by an estimated $560 billion, the CBO also estimates that the policy would reduce gross domestic product (GDP) by four percentage points in 2013, sending the economy into a recession (i.e., negative growth). At the same time, it predicts unemployment would rise by almost a full percentage point, with a loss of about two million jobs.
A Wall St. Journal article from May 16, 2012 estimates the following impact in dollar terms: “In all, according to an analysis by J.P. Morgan economist Michael Feroli, $280 billion would be pulled out of the economy by the sunsetting of the Bush tax cuts; $125 billion from the expiration of the Obama payroll-tax holiday; $40 billion from the expiration of emergency unemployment benefits; and $98 billion from Budget Control Act spending cuts. In all, the tax increases and spending cuts make up about 3.5% of GDP, with the Bush tax cuts making up about half of that, according to the J.P. Morgan report.” Amid an already-fragile recovery and elevated unemployment, the economy is not in a position to avoid this type of shock.
The Term "Cliff" is Misleading
It's important to keep in mind that while the term “cliff” indicates an immediate disaster at the beginning of 2013, this isn't a binary (two-outcome) event that will end in either a full solution or a total failure on December 31. There are two important reasons why this is the case:
1) If all of the laws went into effect as scheduled and stayed in effect, the result would undoubtedly be a return to recession. However, Congress continues to work toward a deal that will alleviate the effects in some form.
2) Even if the deal does not occur before December 31, as appears likely, Congress can - and almost certainly will - act to change the scheduled laws retroactively to January 1 after the deadline.
At the same time, even a "solution" isn't necessarily positive, since a compromise will likely involve higher taxes or reduced spending in some form - both of which would help reduce the debt, but would be negative for economic growth.
With this as background, it's important to keep in mind that the concept of "going over the cliff" is largely a media creation, since even a failure to reach a deal by December 31 doesn't mean that a recession and financial market crash would necessarily occur.
The Next Crisis
Unfortunately, the fiscal cliff isn't the only problem facing the United States right now. At some point in the first quarter, the country will again hit the "debt ceiling" - the same issue that roiled the markets in the summer of 2011 and prompted the automatic spending cuts that make up a portion of the fiscal cliff.

28 December 2012

OPPORTUNITY

A pessimist sees the difficulty in every opportunity. An optimist sees the opportunity in every difficulty. Optimist subscribed our intraday setup and pessimist are still thinking  that how it will work or not work. Optimist started trading with setup already and pessimist are still confuse with the trend and trade. 
Yes If you are Intraday trader and if you have not a good setup then it means you are doing adventure with your capital.
Good luck. 

27 December 2012

NIFTY X- RAY REPORT FOR 28 JAN

Blasting move is  waiting  in Nifty before 31 Dec till 6055. We have Taken position in Nifty on dip today did you?  Nifty future next series is trading with 52 points premium indicating impulsive move may happen in Jan series. Tomorrow is Friday so hope blasting jump tomorrow. Nifty is trading in small triangle pattern and I hope upside breakout is possible.


INTRADAY UPDATE

NIFTY IS FACING STIFF RESISTANCE ON TRENDLINE ON HOURLY CHART. CROSSING ABOVE MAY GIVE BLASTING MOVE IN EXPIRY DAY.


26 December 2012

NIFTY X- RAY REPORT FOR 26 DEC


Nifty recovered in second half again closed above 5900. A trend line resistance is coming around 5925-30 which is strong obstacle for bulls. If cross this level any how will touch successfully 6100

in few days. If does not cross then it will spend some more time in consolidation. Fii bought index future worth rs 163 cores increasing by 77028 contracts. Nifty 5900 put added 1971800 contracts in open interest and 5900 call decreased 1448950 contracts from open interest which is indicating that expiry is possible above 5900. Once nifty break out this range once more blasting and impulsive up move can be seen in nifty in near term. Trend is buy on dip. Use the dip and take a sip.
GOOD LUCK

NIFTY UPDATE

Blasting move is expected ahead but before consolidation should be completed till expiry. My target 6150 is still due in market. 5900 is stiff resistance on chart and downside 5800.

24 December 2012

CONSOLIDATION GOING ON

ARE YOU LOOKING FOR PROFESSIONAL

Are you looking for professional person to look after your account. If yes then it is only two step away
Step 1- Read the terms and condition
Step 2- Make payments

Trading is very different than just getting the research and then trading by yourself. It is very difficult to capitalize on the emotional flux you go through during trading and it requires strong mindset. It require you to be full time traders and complete knowledge on market. If you can't do this then you have a good option for you.
-I manage your Investment portfolio,
-You will have to assign a trading and demat account with us. Because Its not possible to manage to much individual log in system for trading during market hour.
-With one login multi account can be handle easily.
-All trade will done by me, you will be not allowed to involved in
any trading decision.
*Minimum capital intake is Rs. 1 lakh.
*You can view the status of your account after market hour.
*The net profit will be shared with the ratio 20:80
*5% of capital you will need to pay in advance as charges.
*20% is the downside risk. If your capital goes down by 20%, I will stop trading your account.
*Daily trading report will be send via email. Rs 50000 is consider for one lot of nifty , and minimum 2 lots should require for managing portfolio.
*You will have 100% right to quit any time.

We believe in complete transparent approach and so you get daily updates about your investments along with charts that explain and justify the positions held.
 

WISHES


23 December 2012

NIFTY X-RAY REPORT FOR 24 DEC

Volatility may remain continue in our Indian market for next week also. As I have indicated last week that we will see volatile week ahead. I am still bullish with cautiousness in market. Nifty strong support is near at 5815. Watch this level if hold on Monday session then we may expect a recovery. I highly expect nifty may touch 6100 before any big correction. There is  a buy opportunity in nifty at lower level. Trend will enter in negative zone below 5802. Long term trend line support is now near 5735. Any close below this level we may see panic selling in the market. Fresh and confirm rally will start only above 5930 level. All global Indices is waiting for fiscal cliff solution. If solution is not reached to the result then negative impact may seen in the market. and under this situation Nifty may drag to long term trend line 5735 level. Negative divergence is visible  on RSI and Slow stochastic, need to alert. 

22 December 2012

NOTICE

DEAR CLIENTS
THIS IS TO INFORM YOU THAT THE CUSTOMER WHO HAVE SUBSCRIBE FOR INTRADAY DAY TRADING SETUP AND FORMULA, TRAINING WILL BE PROVIDED FROM 10 AM ON 23/12/12 ( SUNDAY). AFTER THAT SEVEN DAYS LIVE MARKET PRACTICE SESSION WILL BE START FROM MONDAY. THEREFORE ALL SUBSCRIBERS ARE REQUESTED TO AVAILABLE ON TIME.
THANKS AND REGARD.

21 December 2012

NIFTY X- RAY REPORT FOR 21 DEC

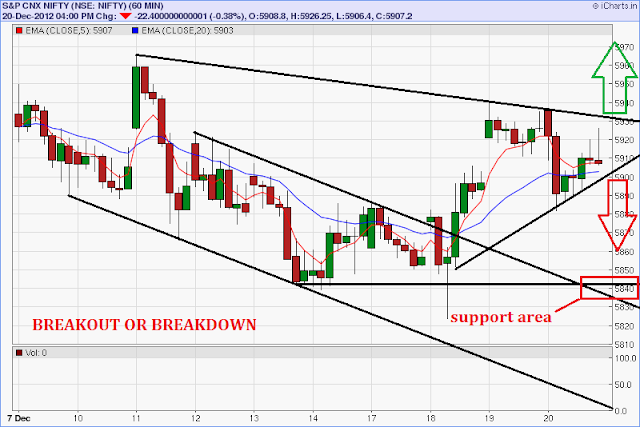
Choppy markets chop up your profits. One of the example we saw today. As given below chart nifty hourly chart is in a triangle pattern and either side breakout may happen in Friday session. For current up trend long traders keep stoploss below 5900 level. breaking this level prices may fall to 5880-5840. If breakout up side happen we may a sharp movement till 5970. I expect that current up move in hourly chart is in third internal wave and as per wave theory third wave is a longest wave so I expect that if nifty give a breakout up side and prices may lift to 5970 ++ on hourly chart in Friday session. This view will be invalid if nifty break downside of the triangle trend line till  more than an hour as shown in below charts.
BEARS BEWARE !!!!!!!!!!!!! 


20 December 2012

TRADE HARD OR TRADE SMART


BUY  INTRADAY AND POSITIONAL MATHEMATICAL AND TECHNICAL TRADING SET UP AND EARN DAILY RS.5000/00  ON 1 LAC INVESTMENT IN FNO. IF YOU ARE TRADING WITHOUT THIS IT MEANS YOU ARE IN DARK. TRADE HARD OR TRADE SMART CHOICE IS YOURS.
YOU TRADE MORE THAN YOU THINK YOU DO 
CHARGES RS 15000/00
LEARN THE MATHEMATICAL PRINCIPLES OF THE PRESENCE OF FIBONACCI, GAN, ELLIOTT AND CANDLESTICK  AND DISPLACED MOVING AVERAGES WITHIN AN HOUR AND MAKE MONEY FROM DAY ONE.
CONTACT:- eyesnifty@gmail.com
Nothing change in technical to much nifty is in up trend only improving stoploss is best option for this current situation. Current stoploss would be 5892 on closing basis. 

19 December 2012

OPEN AN ACCOUNT

TRADE ONE LOT OR 100 LOTS IN FNO
AND TRADE  10 OR 1000 OR 10000 QUANTITY IN CASH SEGMENT PAY BROKERAGE ONLY  RS 20. OPEN AN ACCOUNT IN ZERODHA WITH US AND ENJOY SUPER PROFIT.
 ZERODHA IS FASTEST GROWING STOCK BROKER IN THE COUNTRY. THE BIGGEST CHALLENGE IN BROKERING BUSINESS IS TO RETAIN A CLIENT AS THERE IS ALWAYS SOMEONE OFFERING A BETTER DEAL. 
DO YOU KNOW 95% OF OUR CLIENTS NEVER SWITCH ONCE THEY START TRADING WITH US. 
OPEN AN ACCOUNT WITH US AND ENJOY TRADING.
CONTACT -eyesnifty@gmail.com

18 December 2012

NIFTY X-RAY REPORT FOR 19-12-12

Market gave a breakout over a falling trend line on hourly chart. Most of people expect lot from the market. Most of people expecting that RBI will do rate cut. It did not happen and in hectic they sold prices and pull the index down. But they forget that there is smart money sitting around lower volatility range (5821) by spreading net to trap all the prices at low rate. Stoploss would have been triggered at lower level. Why do you trade on expectation when technical analysis is a wonderful tools and it is available with all smart money. Why don't you have ? You may be also a trading hero. knowledge is power use this and gain this.
As per nifty Eod chart slow stochastic has given upside cross signal at lower level indicating that price may go more higher in near term. As told you near previous expiry that closing may be violent, I am saying this again that nifty may be violent till December end. Nifty has corrected time wise in the wave extension but not price wise to much. I expect nifty may go above 6100++ till Dec end. For this up trend positional long players keep stoploss below 5859.
Almost 8 lakh shares added in both 5800 and 5900 put in open interest, as nifty future was up by 39 points and open interest increasing in current strike on the put side indicating that put has been written today. It seems that there is lots of energy remain in the current up side rally and fresh speed will take place from tomorrow. I am bullish till 6100++ in this year end and definitely you will see again like 2008 bear rally in 2013.  Beware Worst Nightmare for Bulls is ahead in 2013.

17 December 2012

NIFTY UPDATE FOR 17-12-12

Volatile week is ahead. Nifty took support at my projected level 5837 and reversed from there but are you really thinking that market will come in impulsive mode. I don't think so. I have a different count on chart which i have given below. It seems that Nifty was moving in 3rd wave extension so this new 4th wave will be in zig zag pattern. For consider nifty should trade above 5920-30 spot level for up move otherwise volatile move is expected and there will be no surprise if nifty touch 5725. If my wave count is correct then nifty must reverse from this zone and will give full and final move up to 6304 or 6545.
watch 5917-20 level. sustaining above this level will be strong positive.

16 December 2012

6304 OR 6545 ?

ABSOLUTE DO NOT EXIST

In markets, absolute do not exist. The only help an investor gets in anticipating future price trends is given by the possibilities and probabilities that are present in all mathematical game theory. I have been trading since 10 years in the market and I have found that there is only Elliott wave principle, which can give wider variety of price movements and it is able to quantify their possible resolution more accurately. It is best technical tools among all the technical indicators. I have grabbed 3347 points per lot in Nifty since Dec 2011 and have done multiple our lot on every 1000 points. There are many type of investors in the market but no one can earn money like Elliott wave followers. This is wonderful technical tools than others in the stock market. This is the tools which can make anybody cororpati in few years. I have not understood yet that why people are in race of competition of IITs, MBAs, MEDICALs, Banks or any others competitive exams. If any body learn Elliott wave, can make him billionaire in his life.
Learn Elliott wave simple and effective crash course in just Rs.15000. 

14 December 2012

NIFTY X RAY REPORT FOR 14 DEC

Market break the important support yesterday and now standing at crucial support level. Two days before i mention a level 5837. Remember this level is a trend decider level. If break then short term trend can be negative and long term trend line is at 5680 if break this level the real blood bath will start till 5090. I expected that market will jump towards 6100 but it faced resistance near 5950-60 level and fell down. Now there could be two possibilities forming on hourly chart.
1.-- It has formed double bottom formation. market can take support at this level or,
2.-- It may touch lower trend line on hourly chart which is around 5800.
Watch this level care fully.
IF MARKET DOES NOT CLOSE ABOVE 5900 TODAY THEN EXPECT THAT NEGATIVE IMPACT IS HEAVY ON MARKET.


13 December 2012

PMS

IF YOU DON'T KNOW TRADING OR IF YOU DON'T HAVE MUCH TIME  FOR TRADING PORTFOLIO MANAGEMENT SERVICE MAY BE BEST OPTION FOR YOU TO GROWTH YOUR FUND. CONTACT FOR PMS.

NIFTY
5874 SPOT LEVEL IS KEY FACTOR BREAK AND SUSTAIN BELOW THIS LEVEL INDEX MAY TOUCH 5840. 5840 WILL BE TREND DECIDER LEVEL. 

12 December 2012

NIFTY UPDATE FOR 13 DEC

  WAITING FOR 6180
There is no changing in any technical signal and there is no any sign of weakness. Nifty 5864 level will be  trend decider for tomorrow. Broad market is still stronger than index. market is in consolidation mode and taking rest for next move. 6000 call highest open interest  showing stiff resistance on upside. 

Don't you think knowledge is power ?

That's why institutions with the alliance of brokers prefer to keep customers in the dark as they make their money on fees and commissions paid by novice investors. Learn how to control your own destiny by mastering the markets in both the intraday and positional. You'll have the freedom to choose when, where and how to trade as you work toward a secure future. Remember, you'll pay for your education one way or another. You can give your money to the markets through novice trades, or pay it to the institutions as fees and commissions, or pay yourself by learning to trade like a professional.
Be different from the crowd and learn fantastic trading tricks using technical analysis and apply Elliott wave on current charts of Equity, whether you are a seasoned institutional trader or brand new to the stock  market our trading tricks will  help you succeed. Learn trading tricks and get free tips till three months.

11 December 2012

NIFTY X-RAY REPORT FOR 12 DEC

 Are you really confused by seeing the drama today. First market move unexpected upside and didn't sustain. Nifty is forming expanding triangle pattern. I think at 5865 the fall should stop and it may not tasted tomorrow also and expect a big move tomorrow also. But If 5865 broken, the next support is at 5837 level and consider this level as trend reversal level. So long term bull player must consider this level as stop loss. If nifty spot price move above 5930 then expect higher move and bull may take this hight up to 5990-6060 and 6126. In expanding triangle pattern bulls and bear both will confuse. Intraday trading will be difficult for few days.
FIIs bought index future worth rs 487.18 cores and open interest increased by 1% indicating that Fresh long position has been made by Fiis today. We may see more unexpected up move in coming time. But use this rally to exit from your long time investment only. Don't forget this is fifth wave of B wave rally. Market will turn only after making each and every person bullish. let see what happen. According to Nifty option open interest data 6000 call has highest open interest so expect this level as hurdle in near term. After breaking this level sky is unlimited option wise. let see............
GOOD LUCK

FLYING TOWARDS 6100

File:Logo of Pakistani Millionaire.jpg  MARKET MAY TOUCH 6100-6150 VERY SOON. HOLD YOUR LONG POSITION. 
STEP BY STEP MARKET IS ACHIEVING MY ALL PROJECTED TARGET BUT QUESTION IS..... ARE YOU ACHIEVING YOUR TARGET OR NOT ?
IF YES THEN I WISH YOU ALL THE BEST.
IF NOT THEN WHAT ARE YOU WAITING FOR TO JOIN OUR SERVICES.
GOOD LUCK

NIFTY UPDATE

AS NIFTY CLOSED FLAT SO THERE IS NO CHANGING IN TECHNICAL PATTERN. NIFTY TOOK SUPPORT EXACT AT 5888 AND I THINK MARKET SHOULD RESPECT THIS SUPPORT  AND MOVE ABOVE FROM HERE. EVERY TOM, DICK, AND HARRY IS BULLISH ON DALAAL  STREET AND GIVING TARGET OF 6600-7000. WHERE HAD YOU BEEN AT 4800-5000 LEVEL MR. ANALYST. BUT DON,T FORGET BIG BUST IS NEAR. MARKET MAY STRETCH UP TO 6200 IN EXTRIMLY BULLISH CASE  AND I EXPECT BULLISH TREND TILL 3 JANUARY BY ELLIOTT WAVE CYCLE WISE. JUST IMPROVE YOUR STOP LOSS AND BE IN TREND. 

10 December 2012

NOTICE TO SUBSCRIBERS.

DEAR MY SUBSCRIBERS
DUE TO SOME TECHNICAL MISTAKE SOME OF YOUR CONTACT DETAILS MIGHT LOST. THEREFORE  IF YOU READ THIS NOTICE  AND IF YOU DONT GET ANY SMS TILL 10 AM TODAY ON YOUR MOBILE PLEASE FEEL FREE TO INFORM ME. OR AS SOON AS YOU READ THIS NOTICE INFORM ME YOUR CONTACT DETAILS VIA SMS OR MAIL.
REGARD. 

9 December 2012

MANAGING PORTFOLIO CAN BE BEST OPTION FOR YOU.

Trading is very different than just getting the research and then trading by yourself. It is very difficult to capitalize on the emotional flux you go through during trading and it requires strong mindset. It require you to be full time traders and complete knowledge on market.  If you can't do this then you have a good option for you. 
-I manage your Investment portfolio,
-You will have to assign a trading and demat account with us. Because Its not possible to manage to much individual log in system for trading during market hour.
-With one login multi account can be handle easily.
-All trade will done by me, you will be not allowed to involved in
any trading decision.
*Minimum capital intake is Rs. 1 lakh.
*You can view the status of your account after market hour.
*The net profit will be shared with the ratio 20:80
*5% of capital you will need to pay in advance as charges.
*20% is the downside risk. If your capital goes down by 20%, I will stop trading your account.
*Daily trading report will be send via email. Rs 50000 is consider for one lot of nifty , and minimum 2 lots should require for managing portfolio.
*You will have 100% right to quit any time.

We believe in complete transparent approach and so you get daily updates about your investments along with charts that explain and justify the positions held. 

BANK NIFTY X-RAY REPORT FOR 10 DEC AND WEEK AHEAD

Last week I have shown a triangle breakout pattern on bank nifty chart. The index has jumped 204 points last week and made high at 12480. Bank nifty has played important roll to take market up but it is near its strong resistance level. 50% retracement level is at 12484 and next retracement level is at 61.8% which is at 12804. Any break above 12484 bank rally will continue to 61.8% level otherwise index may drag downward.

 
 I am going to show you three big Bank chart to understand this confirm this views.
First just see the sbin chart below. There are cluster of resistance on SBI chart. Immediate resistance at 2340. The stock has made high at 2339.60 and slipped from there in intraday.
Now lets see the chart of Icici bank chart. A long term rising trend line resistance is coming on ICICI bank chart which is at 1145. The stock has made high at 1144.45 and closed at 1131.70. The stock is its near 78.6% retracement level. Any break above this level stock may rise to 1190-95, otherwise stock may touch lower rising trend line.

Now lets consider AXIS BANK chart. There is coming resistance at 1367 on Axis bank chart which is previous weekly high. ICICI bank has tasted its 78.6% level so I hope that bullish sentiment will take the price upto 78.6% retarcement level which is at 1432. Therefore we may come to conclusion that all the above chart is at its near resistance level. Watch this level carefully any break of the resistance chart may touch the above projected level. I hope that all Negative sentiments has finished from gov side. Rbi policy is on next week and all these stocks may rise higher side.
GOOD LUCK.


8 December 2012

NIFTY X- RAY REPORT FOR 10 DEC & NEXT WEEK

 I have written the two possibilities in my previous post and one of my technical friend wrote me that why didn't you write clear cut direction. In other words Why i have not written about the particular single direction. You will automatically find the answer below that what would have been the reason behind to write this. I have posted lots of chart below to understand clear cut picture. Nifty was waiting for clear clue of FDI. As we know that Govt had successfully passed the FDI in Retail both in Lokh sabha and Rajya Sabha, Govt now is looking to pass the Insurance and Pension bill in Parliament. Also there is a huge expectation that RBI may cut the Interest rate in coming week, which may inject the Positive sentiment in the market. But I think it may give a greed to bears before going up. Below 5880 it will slip towards 5815 to 5765. But If nifty has to go straight upside then it must be cross a LAXAMAN REKHA which is at 5950. If it cross and close above this level expect a straight rally heading to 6030--6150. But 5880 must hold. So assume this level as a reversal level for very short term.


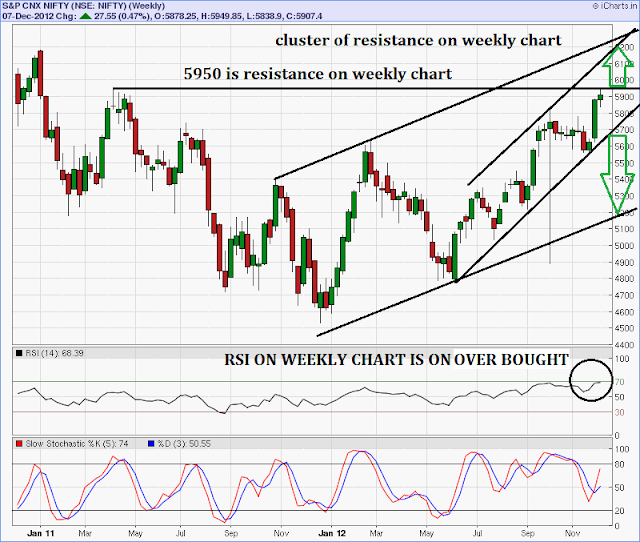
On daily chart just see the hight of lower blue colored rectangle. it is almost 600 points so there is high probablities remain on the chart that price may touch the upper line of upper rectangle. On hourly chart as we are seeing that nifty is falling towards its lower trendline support which is around 5815. There for falling till 5815 is also on card. I highly expect that nifty will slip lower first and then it may go upside. For lower target nifty must break 5880 level. On daily and weekly chart RSI is in overbought zone so traders must be alert on up side. As we know that we are trading in fifth wave and nifty has allready retraced 61.8% of 2011 fall, so we need alertness every time with our overnight position. 

7 December 2012

BE A TRADING HERO


Be different from the crowd and learn fantastic trading tricks using technical analysis and apply Elliott wave on current charts of Equity, whether you are a seasoned institutional trader or brand new to the stock  market our trading tricks will  help you succeed.
  • Accurate technical analysis and a winning attitude.
  • Successfully incorporate the Elliott Wave Principle.
  • Detailed analysis of Nifty and Bank Nifty.
  • Identify turning points and trends in the market.
  • Guidance to position for proper entry and exit.
 Daily Technical Updates, Intraday and Long-term Wave Counts, Educational Resources, and more

 Be independent & Learn practical way of trading.
Learn Intraday and swing Trading tricks and transform yourself from being a ordinary to an expert trader and learn to identify the best trading setups!
Does any one of the following happen to you?
  • You buy stock on the basis of good news or better than expected result and price of the stock still keeps falling after you take the long position?
  • Why does market moves in your favor but only after hitting your stoploss?
  • You are always out of the market during best of the trends!
If your answer to any one of the above question is YES, then you belong among 90% of crowd that faces similar situations everyday.
I have designed a crash course of trading for intraday/ positional/swing trade. The program is not only about concepts of trading but it will teach you a fantastic trading trick to make money out of it. It is a basic course for all who want to make it big in the stock markets. To be a successful trader one need not to be only good with tools of technical analysis but also a lot psychological traits such as quick Decision making, Temperament, confidence, focus and more. The crash course is for all- for beginner, who is new to world of trading, For those who are already into technical analysis and for those aspiring to become professional traders.  If trading is your passion and you desire to make it a profession, then this course is best for you to make handsome money from stock market.
Course fee is Rs.15000/00 only.

6 December 2012

NIFTY X-RAY REPORT FOR 07 DEC

 Nifty fell almost 100 points from its high in morning session and recovered sharply and closed above its previous close. Short sellers tried to pull the Index down but bulls shows its energy in latter half. In my Intraday session report I suggested that wave may expand higher side. short players must be trapped today. I have been talking about 5950 since so many days. It touched 5942 today and closed at 5930 level. How ever wave 1 and wave 3 has spent 5 weeks so I expect that wave 5 should spend 3 weeks. So wave 5 can be extended towards 6200 to touch the upper trend line, which is shown in below charts. Prices Rise was very impulsive in nature but Fii figure in Fno segment is not impulsive and this activity compel me to think that tomorrow is Friday. Will tomorrow be top of Indian market or it will go directly towards 6200. Tomorrow  Friday will really be FRY DAY ?
Overall aggressive traders keep stoploss at 5815 spot price level and be long side. There are cluster of resistance on chart above this zone. For sustaining and energetic up move nifty must jump the all resistance with  gap up action.
Nifty is continue making 52 week high on chart. As per slow stochastic and RSI indicator nifty daily chart is in overbought zone. Nifty 6000 call 239,250 fresh contracts in open interest and it is standing with highest no of open interest in call side. The volume in 6000 call was impulsive today. There is no change in put call ratio today and it is at 1.07. When I consider chart and data it appears that nifty is becoming tired but impulsive rise in price confuse me and compel me to think that price in 5th wave may extend.
Smart players should not take fresh entry in current situation and always consider to exit from long term investment. Remember every day will be crucial day further ahead. Don't be aggressive in long side. 

ONE PIECE OF INFORMATION

Many traders are able to make some money when their setups occur, but then give their profits back when the market goes into CONSOLIDATION or became volatile.
If only you could know when the market was going to be choppy; That one piece of information could possibly turn you into a profitable trader! When market fell today so many people would be shocked. But i gave hint on the right time to exit from short and gave indication about expansion of wave.

I don't know how many of you take this information to protect your trade and live in right direction but today was wonderful session for trading for me and my subscribers.
Subscribe our lets go to 1 lot to 32 lots plan and enjoy profit.

TECHNICAL PREDICTION

INTRADAY UPDATE

IT SEEMS THAT 5TH WAVE MAY EXTEND FURTHER UP SIDE AND ASSUME THIS FALL AS A HEALTHY CONSOLIDATION. TREND CHANGER LEVEL WILL BE 5815. EXIT FROM SHORT WILL BE WISE DECISION FURTHER AND BUY AGAIN NIFTY IF CROSS 5900. TARGET WOULD BE 6100++

I HAVE NOT SEEN ANY EXTENTION IN WAVE 1 OR WAVE 3 OF 'B' WAVE SO THERE IS HIGH PROBABLITIES REMAIN THAT WAVE MAY EXTEND IN 5TH WAVE. THIS IS FIRST POSSIBILITIES.

SECOND POSIBILITIES IS THAT IF 5815 BREAK AND SUSTAIN BELOW THIS LEVEL THEN WE MAY EXPECT FURTHER MORE DOWN MOVE. AND IF 5765 LEVEL BREAK THEN IT WILL BE CONFIRM THAT TOP HAS TOUCHED ALREADY.

5 December 2012


LETS GO FROM ONE LOT TO 32 LOTS IN JUST 20 MONTHS

TRADE HARD OR TRADE SMART

  • Are you trading blind ?
  • Have you taken an informed decision after your own analysis ?
  • Do you know the history of the stock which you are planning to invest in ?
  • Do you need to do any technical analysis before you take any investment decision ?
  • Or do you want tension free trading ?
  • Do you want to see your rs 50000 into 16 lakh in just 20 months ?
  • Then...................? Only one thing you have to do....       
  •      

NIFTY X-RAY REPORT FOR 06 DEC

Is negative trend is going to start from 06 DEC or trapping bull move will be seen in our Indian market? At current situation if we consider on chart because I am a chartist, and chart speak every thing. Lots of long position would have been made by Indian traders today in expectation of FDI. 14 of 18 parties in parliament voted against FDI. Yet government won the match. Thats the power of M factor. Personally if you will ask me then I will say FDI is good for Indian economy. FDI in Retail may Benefit Farmers & Final Consumers & affect Middlemen. But in Turn it may help control supply shock Inflation. I Support it. 
I have zero position in market now. I won't do fresh long position at current situation. Current put call ratio is at 1.07 still in positive zone and fresh long has been added today. It seems that to many position has been taken as a opportunity of FDI reaction. On the international market front all Asian indices was on fire but our market was on consolidation as i was expected and indicated you in my yesterday post. Fii sold 2723 contracts worth rs 83.84 cores and open interest increased by 9915, as nifty future was up by 16 points and fii sold position indicating that fii has booked profit on higher level. Nifty short term support has formed at 5855 level and I think this will work as a short term trend changer level. Nifty long term lower trend line is now at 5650, any break of this lower trend line will confirm that bull trend has completed it destination of 2012 and bear will take all revenge in 2013. Up side 5917 and 5927 will be trend confirmation point. Watch the trend on thursday if trade below 5885 then trade negative and if trade above 5927 then trade positive.
GOOD LUCK 
HAPPY TRADING

Disclamer:-

Futures and Options trading have large potential rewards, but also large potential risk. You must be aware of the risks and be willing to accept them in order to invest in the Futures and Options markets. Don't trade with money that you can't afford to lose. This is neither a solicitation nor an offer to Buy/Sell Futures or Options.

The contents of this site are for general information purposes, only. The strategies/plan discussed above in this thread/site is made by me based on data which is operated and maintained by third parties. However it is tested and proved every attempt has been made to assure accuracy, but it is by me only. We assume no responsibility for errors or omissions. Examples on this site and in the manual are provided for illustrative purposes and should not be construed as investment advice or strategy. The future data manual is for informational purposes only. These predictions/tips are technical , based on charts conditions ONLY. This is only a guideline, the decision has to be taken after logical thinking by you. Technical analyst and astrologist will not be liable for any personal or financial losses or profits.

The information and views in this website & all the services we provide are believed to be reliable, but we do not accept any responsibility (or liability) for errors of fact or opinion. Users have the right to choose the product/s that suits them the most.

By your act of reading this independent and individual market research, you fully and explicitly agree that Rajesh Singh or My website (www.niftyeyes.blogspot.in/www.niftyeyes.in) will not be held liable or responsible for any decisions you make regarding any information discussed herein. Take a proper advice from a certified adviser before invest in future and option market.