AUTOMATED TRADING

AUTOMATED TRADING

12 December 2013

NIFTYLATEST ELLIOTT WAVE PATTERN AND TREND FURTHER

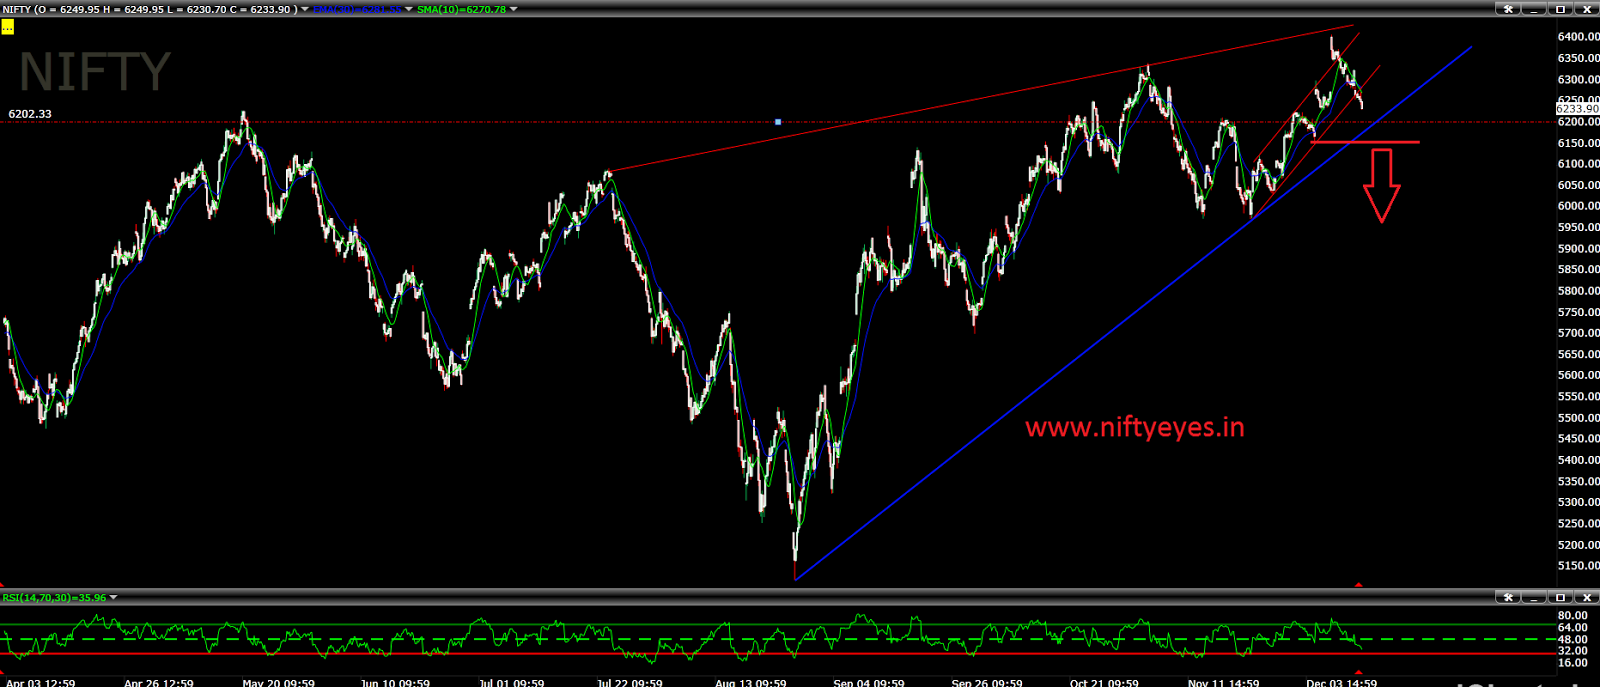
In my previous post we wrote that price should move at least towards 6440. and 6345 level will be short term reversal on hourly and daily chart.  Nifty made high 6415 and reversed from there. As we discussed earlier that irregular correction pattern has seen on nifty daily chart. In wave c of irregular pattern form five wave and we have not seen any impulsive wave pattern in wave c. So I have levelled as a,b,c,d,e. A negative divergence on nifty daily chart is favouring down trend has occurred. Nifty has made four consecutive lower low formation on daily chart. On hourly chart we are also seeing channel breakout. any move below 6200-6190 will create panic selling in nifty. Advance decline ratio also not supported on higher level. Now lets analyse option interest. Nifty 6300 call added almost 12 lakh shares in open interest and premium lose by 46 point indicating writers were aggressive in 6300 call today. 6200 call added 4 lakh shares and premium lose by 61 points indicating that writers are confident and assuming that nifty may slide below 6200.
As per chart pattern bulls last hope is at 6170. Break below expect free fall.


Retail inflation jumps to 11.24% in November; industrial

production contracts by 1.8% in October

November IIP at -1.8%.

SGX NIFTY Trading at 6215.

10 December 2013

NIFTY ELLIOTT WAVE LATEST PREDICTION 6600


Currently we are seeing irregular correction on nifty daily chart.
Lets see what is irregular correction ?
In this type of correction, Wave B makes a new low. The final Wave C may move up to the beginning of Wave A, or above it.
Now lets see the nifty chart below

Current move is wave C and wave c should form five wave formation and we are not seeing any five impulsive wave formation in the nifty chart so we can assume that this may be diagonal in a,b,c,d,e formation and if we find any negative divergence formation, will provide clue that short term up move is in mature stage. As per fibonacci ratio rule of Elliott wave wave C should be either 1.62 x Wave A or 2.62 x Wave A.
As per nifty chart above Nifty has given multi year breakout  above 6350 level. The next resistance coming on the chart is around 6480-6550. I hope that this up move should take prices atleast towards 6440 levels. The multi year trendline is also coming around 6500 level. But the upper trend line value will be increase day by day if nifty try to rest here for few days.

Learn the fantastic way of Elliott wave and get free support with one recommendation on Nifty and two recommendation on stocks everyday and its absolutely free. Just join our trading club and be different from crowd. for more details feel free to mail at-  eyesnifty@gmail.com
Lets see the picture on larger time frame in below chart.
See in this chart and if this is irregular correction than as per elliott wave Fibonacci projection this move should terminate around 6609 where 1.15 x wave A is placed or 1.25 x Wave A which is around 6781 which will be maximum stretch in the up move i think. 6345 is now strong gap support for any short term reversal on hourly or daily chart.
Good Luck.........


9 December 2013

NIFTY IS AT MULTI YEAR HIGH

 The state election result with clear majority of BJP can lead market towards strong gap up opening today. Market is at multi year high  and people want BJP to be elected to stay bullish on markets. The previous gap around 6230 will be now major game changing level for down trend. Now as long as this level is protected trend will be highly bullish.

Disclamer:-

Futures and Options trading have large potential rewards, but also large potential risk. You must be aware of the risks and be willing to accept them in order to invest in the Futures and Options markets. Don't trade with money that you can't afford to lose. This is neither a solicitation nor an offer to Buy/Sell Futures or Options.

The contents of this site are for general information purposes, only. The strategies/plan discussed above in this thread/site is made by me based on data which is operated and maintained by third parties. However it is tested and proved every attempt has been made to assure accuracy, but it is by me only. We assume no responsibility for errors or omissions. Examples on this site and in the manual are provided for illustrative purposes and should not be construed as investment advice or strategy. The future data manual is for informational purposes only. These predictions/tips are technical , based on charts conditions ONLY. This is only a guideline, the decision has to be taken after logical thinking by you. Technical analyst and astrologist will not be liable for any personal or financial losses or profits.

The information and views in this website & all the services we provide are believed to be reliable, but we do not accept any responsibility (or liability) for errors of fact or opinion. Users have the right to choose the product/s that suits them the most.

By your act of reading this independent and individual market research, you fully and explicitly agree that Rajesh Singh or My website (www.niftyeyes.blogspot.in/www.niftyeyes.in) will not be held liable or responsible for any decisions you make regarding any information discussed herein. Take a proper advice from a certified adviser before invest in future and option market.