AUTOMATED TRADING

AUTOMATED TRADING

31 December 2013

NIFTY AND STOCKS UPDATE FOR 31 DEC

SBIN

NIFTY
We have some alternate view on nifty. We have labelled as per Elliott wave perspective in chart below.
Lots of stocks showing negative divergence on chart. Trading towards upside should be very cautious. Why we are saying this because nifty above 6320 level has failed to show strong momentum 
The overall structure is not looking  impulsive as of now. This increases the possibility that wave b from the high of 6415 is still ongoing in the form of Flat correction. We need few more days to confirm the next move. Trade Intraday for few days.

BANK NIFTY

HPCL


26 December 2013

TECHNICAL TRADING SYSTEM

NIFTY
Click on charts below for larger view.
Nifty took support around 6250-60 level if break it may touch previous swing level 6160.


SIEMENS
We have found clear five wave completion on siemens hourly chart with negative divergence. Any move below 650 it may drag towards 615 level.

HINDUSTAN UNILIVER
We are regular watching this chart, has perform like falling wage pattern and it seems that it is ready to break. Keep your eyes on this stock and any move above 571.50 stock may blast and may zoom to 640 level.

ASIAN PAINTS
Asian Paints has similar pattern like HUL and ready to blast, any move above 498 will kiss 540 level very soon.

AIRTEL
Bharti Airtel has form like ascending triangle, In this technical condition breakout should come towards upside.  breakout will come above 332. may spike up 10 points very sharply if breakout happen. 


22 December 2013

NIFTY X-RAY REPORT FOR 22 DEC

POSITIVE BUT VOLATILE MOVE IS AHEAD.

On December 10 we projected the move up to 6609. Nifty made new high but fell from there, but we consistently writing that one final move is due before big sell off. Nifty bounced back from 6140 level and now targeting for once again new high. All negative news has been discounted now.
In our previous post we predicted possible up move in Bank nifty, BHEL, RELINFRA, and Sun pharma. Sun pharma didn't executed but all three gave a sharp bounce back.

Just see the longer picture on nifty and possible wave formation.


Open Interest analysis:-
Nifty 6200 put added 21 lac contracts in open interest and premium lose by 10 point and nifty 6300 put added 14.5 lac contracts in open interest and premium lose by 37 points indicating 6300 and 6200 put has been written in Friday session. All these indicating move above 6300 for next session.

As per Elliott wave analysis we will have to watch that either move make new high again or not. Currently we are moving in second standard of correction. If correction terminate here than down move should start from 6600. If correction extend into third standard than it can slide first towards 6000 level and then it may jump for final spike upto 6950 level.  Upper trendline resistance is coming now around 6600. Bias are positive now. 
In short as long as nifty is protecting 6130 level our view is positive for very short term for possible target 6600 in near term.

HINDUSTAN UNILEVER  IS READY TO BLAST.

19 December 2013

NIFTY LATEST UPDATE FOR 20 DEC

NIFTY

Be cautious towards down side. we have seen positive divergence on Bank nifty hourly chart. Any move above 11200 will provide first indication. As per Elliott wave i expect that one final up move is still due before major selling start. In the above chart of nifty , any close below 6120 will force us to count alternate. Any move above 6196 will provide first clue that up move is still due, till than wait and watch and let the market decide.
 BANK NIFTY


BHEL
Clear five wave formation is visible on BHEL daily chart and stock may zoom upto 180-182 level in very near term.

RELINFRA

SUNPHARMA
Sunpharma is facing stiff trend line resistance on daily chart. But this time we hope that breakout should come. any move above 587.50 will provide confirm breakout.


Nifty latest update for 19 dec

Three days back we indicated that nifty may take support around 6150-6124. Nifty made low 6132 and reversed back from there. As per elliott wave i have leveled as double zig zag pattern in A.B.C.X format. Further we will have to see that either wave form in corrective formation in A.B.C or diagonal. 6190-6200 will act now as a strong support. Trade only long side as long as 6150 is intact.

12 December 2013

NIFTYLATEST ELLIOTT WAVE PATTERN AND TREND FURTHER

In my previous post we wrote that price should move at least towards 6440. and 6345 level will be short term reversal on hourly and daily chart.  Nifty made high 6415 and reversed from there. As we discussed earlier that irregular correction pattern has seen on nifty daily chart. In wave c of irregular pattern form five wave and we have not seen any impulsive wave pattern in wave c. So I have levelled as a,b,c,d,e. A negative divergence on nifty daily chart is favouring down trend has occurred. Nifty has made four consecutive lower low formation on daily chart. On hourly chart we are also seeing channel breakout. any move below 6200-6190 will create panic selling in nifty. Advance decline ratio also not supported on higher level. Now lets analyse option interest. Nifty 6300 call added almost 12 lakh shares in open interest and premium lose by 46 point indicating writers were aggressive in 6300 call today. 6200 call added 4 lakh shares and premium lose by 61 points indicating that writers are confident and assuming that nifty may slide below 6200.
As per chart pattern bulls last hope is at 6170. Break below expect free fall.


Retail inflation jumps to 11.24% in November; industrial

production contracts by 1.8% in October

November IIP at -1.8%.

SGX NIFTY Trading at 6215.

10 December 2013

NIFTY ELLIOTT WAVE LATEST PREDICTION 6600


Currently we are seeing irregular correction on nifty daily chart.
Lets see what is irregular correction ?
In this type of correction, Wave B makes a new low. The final Wave C may move up to the beginning of Wave A, or above it.
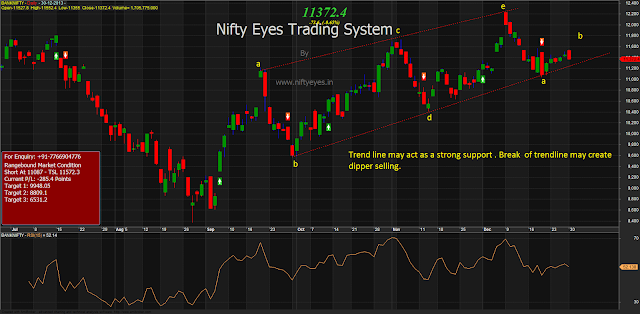
Now lets see the nifty chart below

Current move is wave C and wave c should form five wave formation and we are not seeing any five impulsive wave formation in the nifty chart so we can assume that this may be diagonal in a,b,c,d,e formation and if we find any negative divergence formation, will provide clue that short term up move is in mature stage. As per fibonacci ratio rule of Elliott wave wave C should be either 1.62 x Wave A or 2.62 x Wave A.
As per nifty chart above Nifty has given multi year breakout  above 6350 level. The next resistance coming on the chart is around 6480-6550. I hope that this up move should take prices atleast towards 6440 levels. The multi year trendline is also coming around 6500 level. But the upper trend line value will be increase day by day if nifty try to rest here for few days.

Learn the fantastic way of Elliott wave and get free support with one recommendation on Nifty and two recommendation on stocks everyday and its absolutely free. Just join our trading club and be different from crowd. for more details feel free to mail at-  eyesnifty@gmail.com
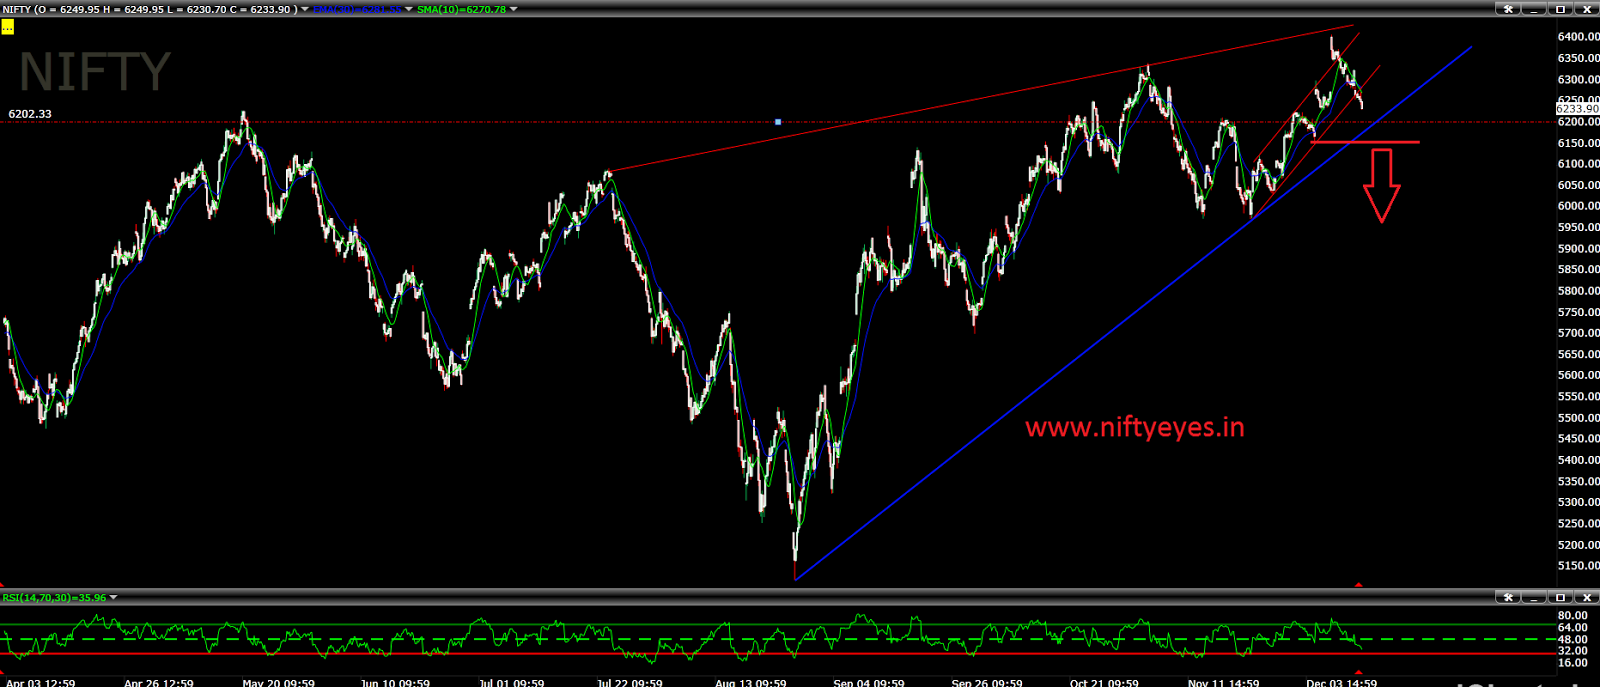
Lets see the picture on larger time frame in below chart.
See in this chart and if this is irregular correction than as per elliott wave Fibonacci projection this move should terminate around 6609 where 1.15 x wave A is placed or 1.25 x Wave A which is around 6781 which will be maximum stretch in the up move i think. 6345 is now strong gap support for any short term reversal on hourly or daily chart.
Good Luck.........


9 December 2013

NIFTY IS AT MULTI YEAR HIGH

 The state election result with clear majority of BJP can lead market towards strong gap up opening today. Market is at multi year high  and people want BJP to be elected to stay bullish on markets. The previous gap around 6230 will be now major game changing level for down trend. Now as long as this level is protected trend will be highly bullish.

6 December 2013

BE CAUTIOUS LONG SIDE NOW

Nifty open gap up and traded down whole day. We have seen clear five wave completion on nifty hourly chart with negative divergence as shown in picture below. Any up move from here may extend the fifth wave. Channel breaking downside will confirm that down move has started. Some more chart like infosys, LT, etc are also showing negative divergence. so be cautious towards long side.
What if you believe a stock will continue to fall but would like to short at a better price or a less risky entry? Well guess what? There is a way! It’s called divergence trading.

In a nutshell, divergence can be seen by comparing price action and the movement of an indicator. It doesn’t really matter what indicator you use. You can use momentum indicators.  The great thing about divergences is that you can use them as a leading indicator, and after some practice it’s not too difficult to spot.
When traded properly, you can be consistently profitable with divergences. The best thing about divergences is that you’re usually buying near the bottom or selling near the top. This makes the risk on your trades are very small relative to your potential reward.
Higher Highs and Lower Lows
Just think “higher highs” and “lower lows”.
More details to our club members................
Learn fantastic way of technical analysis absolutely free and get daily recommendation free.


4 December 2013

LONG SIDE IS BETTER DIRECTION

Long side trade is better direction for nifty than short side till nifty is above. See the below chart. It seems five wave moves on pattern  and fifth is due. This count will be invalid if nifty go below 6105 level. So I think that minor dip is buying opportunity.

3 December 2013

My latest view

Nifty continued to move higher in a very tight range. The trend is still cautiously positive as long as it is protecting 6110 level.

As shown in 60 mins chart below, prices are moving higher in an upward channel. As long as this channel is intact the trend will remains positive. Once nifty cross above 6220, prices may kiss 6350 level very soon.  If break 6140 will result into break of the channel and so one can now trail stops for existing long positions towards this level. 
 Nifty is struggling since 2008 onwards around 6350 level which is next big resistance which it has not crossed yet. But momentum looking this time strong and I expect that Nifty should also make life time highs.
However, we are seeing only 4 to 5 max green candles for over a year now.  So any consecutive more than 5 green days will provide hint that trend is changing on longer term basis But any move below 6110 will indicate the upside move was another short trend affair only and the range bound movement will then continue. 

In short any move above 6220 will infuse buying force upto 6350-6400 level, and any move below 6110 there will be high chances to re taste 5970 level.


1 December 2013

NIFTY NEXT TREND

PUT CALL RATIO, OPTION OPEN INTEREST DATA AND CHART PATTERN ALL ARE IN FAVOR OF BULLS.
ABOVE 6220 BULLS TARGETING 6500 IN FEW WEEKS.
UNTIL NIFTY IS PROTECTING 6100 LEVEL THERE IS POSSIBILITIES OF TOUCHING OF 6500 LEVEL.  


25 November 2013

Strong move is awaiting in further direction.

Huge volatile days seen in past six days. Nifty has given sharp bounce back from previous swing low 5970 level. Today Nifty 6100 put added 23 lakh contracts in open interest and 6100 call decreased 11 lakh shares indicating that strong up move is awaiting in the further direction. Trade further Intraday till this expiry.  In the below chart we have drawn a channel and it seems that lower channel of trendline is providing good support on nifty daily chart. Consecutive two higher high will provide strong bullish indication. Go long above 6120. 
Click on chart for its larger view.


21 November 2013

Nifty Open interest indication

Nifty 6000 and 6100 call added huge 25 lac and 22 lac contract in open interest indicating that both strick price has been written today. Nifty loosen its all rise which it gained in three days. Price fallen in less time rather than rise time indicating that fall is impulsive. As per Elliott wave if this falling wave is 3 than it may surprise many and price may slide sharply with gap down action.  In my previous update we wrote that any break below 6100 will slide nonstop to 5800 level. Any jump of 30-50 point should use to sell on rise.


20 November 2013

Nifty Latest update

Yesterday wrote that current Elliott wave pattern for short term view is doubtful. Nifty resisted around 6210 level and fell sharply and halt at 6110 level. Yesterday wrote also until nifty break 6110 view is positive. Be careful at this level break below 6100 will drag nifty towards 5800 nonstop.

Join Nifty eyes trading club and earn 1 crore in just 3.5 years. Start your Journey with Rs 50000 capital.
Good Luck. 

19 November 2013

ELLIOTT WAVE POSSIBLE SHORT TERM MOVE

ELLIOTT WAVE POSSIBLE SHORT TERM MOVE

Here i am posting three possible Elliott wave count for short term perspective. Market fell consecutive 8 days in previous week but we have not seen any sharp downfall of 100 or more than 100 points. But nifty recovered up to 61.8% retracement level in just two days indicating that upside momentum is very strong.
Any move above 6260 will force nifty to jump upto 6500 level very sharply. Untill unless nifty break 6110 level towards downside my very short term view will be positive. 
As per Elliott wave perspective short term view is very doubtful. Chart no 2 possibilities are very much.
Click on chart for its larger view.
CHART 1

CHART 2

CHART 3 MONTHLY CHART


17 November 2013

Caution ahead

Market reversed from the top as my technical assumption was and we have given many times about the possible road map of nifty. Currently We have some doubt because Elliott wave formation has not giving clear picture on the chart. Market fell consistently eight days but we have not seen any impulsive down move of more than 80 points which happen few weeks ago 100-150 points rally in a single day. In other words market fell but in very slow momentum. 
So I feel that 6141 Spot Level on closing basis will flow water on bears who is dreaming for lower level. So This week price action will be very important for both bulls and bears. Any move above 6141 (spot price) with gap up action will provide strong and fast up move to create new high. Any fall below the gap or previous day low will provide us down indication that one more down wave is pending towards 5876 level.

Aggressive trading will be very dangerous this weak. Trading without proper guidance can be adventurous.
Go for Positional long above 6150 for target 6250
and go for Positional short below 6100 for target 5920  


14 November 2013

ELLIOTT WAVE PREDICTION ON HOURLY CHART

NIFTY UPDATE

Nifty 6100 call added 13lac contracts in open interest consistently two days indicating that as long as 6090-6110 is protected my short term view will be bearish on nifty. Sgx nifty is showing 40 points up so we think that any bounce should be use for selling.
RSI and 21 day exponential Moving average is working well on nifty chart since one year. I expect a down move towards 5930. Where I also expect that nifty may spike up upto 6100 level. Use to short.
 

11 November 2013

NIFTY TREND LATEST UPDATE

Nifty has given consecutive five days red closing and closed at 6140 level. In my  17th October post  I had written that nifty is in fifth wave extension and it may kiss 6200-6300 level. It went exactly as my technical expectation. 
Now nifty has given consecutive five red closing on daily chart. As we are seeing below chart that nifty RSI indicator has not closed above 70 level since January 2013. Sustainable move above 70 level will indicate that long term trend has been changed. 
Any close below 6180 followed by 6040 level will give confirmation for bigger negative trend.


Just trade with our crorepati plan in our association without paying any charge and do double your capital in 3-4 months in future trading.
Get daily recommendation in nifty and stocks.

8 November 2013

Yesterday recommended positional trader keep stoploss at 6280 spot price on closing basis. Market made sharp upmove and faild to sustain higher level and closed below 6200 level. For today fresh trader may short nifty at current level with stoploss at 6260 for 6100 target or more lower. Positional trader keep stoploss at 6260 on closing basis.

7 November 2013

Trading update

Intraday player Go short below 6210 spot price keep stoploss at 6260. Positional trader keep yesterday short stoploss at 6280 on closing basis.

6 November 2013

Go short on pull back around 6280 spot nifty price keep 6310 as stoploss and target of 6220. Below 6220
motif stop to cost and use trailing stop method for capturing the entire trend. Long positions can be created above 6320 with day’s low as stoploss and target of 6350.

26 October 2013

VOLTAS


A positive negative divergence has seen on VOLTAS Hourly  chart. any sustainable move below 83.75 will take price till 79 level very soon. Keep stoploss at 86.
click on chart for its larger view.


Disclamer:-

Futures and Options trading have large potential rewards, but also large potential risk. You must be aware of the risks and be willing to accept them in order to invest in the Futures and Options markets. Don't trade with money that you can't afford to lose. This is neither a solicitation nor an offer to Buy/Sell Futures or Options.

The contents of this site are for general information purposes, only. The strategies/plan discussed above in this thread/site is made by me based on data which is operated and maintained by third parties. However it is tested and proved every attempt has been made to assure accuracy, but it is by me only. We assume no responsibility for errors or omissions. Examples on this site and in the manual are provided for illustrative purposes and should not be construed as investment advice or strategy. The future data manual is for informational purposes only. These predictions/tips are technical , based on charts conditions ONLY. This is only a guideline, the decision has to be taken after logical thinking by you. Technical analyst and astrologist will not be liable for any personal or financial losses or profits.

The information and views in this website & all the services we provide are believed to be reliable, but we do not accept any responsibility (or liability) for errors of fact or opinion. Users have the right to choose the product/s that suits them the most.

By your act of reading this independent and individual market research, you fully and explicitly agree that Rajesh Singh or My website (www.niftyeyes.blogspot.in/www.niftyeyes.in) will not be held liable or responsible for any decisions you make regarding any information discussed herein. Take a proper advice from a certified adviser before invest in future and option market.