

AUTOMATED TRADING

23 November 2012
I have given a trail call in nifty future which was based on intraday only.
I just forgot to write one thing that if you are trading on this recommendation then trade double quantity after stoploss hit.
suppose you buy nifty 50 quantity at 5636 and if your stoploss hit in intraday trade then short double quantity for negative trade. In other words you may short 100 quantity.
in short trade target hit today.
INTRADAY ACTIVITY
TRAIL 1. TIME 10.08AM
BUY NIFTY FUTURE ABOVE NIFTY 5639 SPOT NIFTY PRICE
STOPLOSS AT 5618
TARGET -1= 5645
TARGET -2= 5654
0R
SELL NIFTY FUTURE BELOW 5618 SPOT PRICE
STOPLOSS 5636
TARGET 1= 5608
TARGET 2= 5601
KEEP AWAY YOURSELF BETWEEN 5618-5636 SPOT PRICE .
21 November 2012
NIFTY X- RAY REPORT FOR 22 NOV
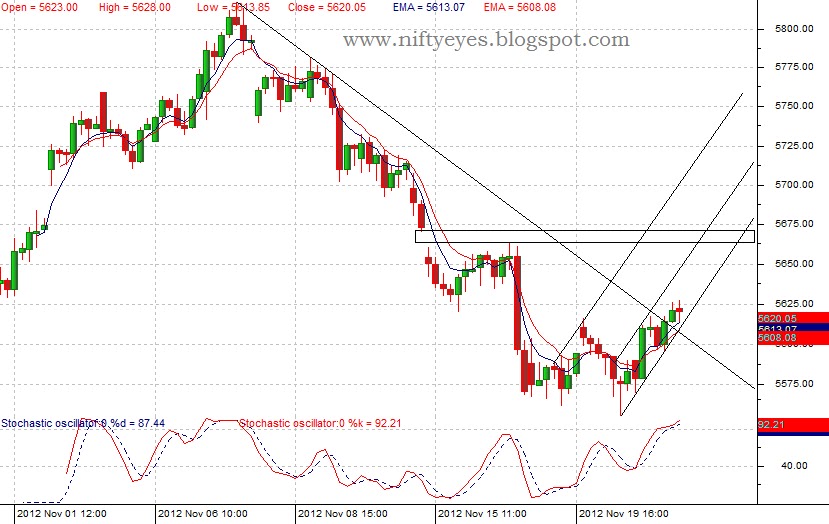
Again volume was greater than yesterday in future segment. Bulls protected 5550 level and closed above its ten days falling trend line resistance. Another resistance is around gap area around 5662- 5673, sustaining above this level will give express rally, which is clearly visible on hourly chart. Nifty 5600 put added 1,861,850 shares in open interest, seems that 5600 level is ready to give support nifty for next session. Nifty future open interest decreased by 161050 contracts from November series and added 400250 contracts in December series. As nifty Future is up by 38 points of Dec series and fresh contracts added in OI indicating that Smart Money are buying nifty of Dec series. Put call ratio has risen from 0.98 to 1.03 giving bullish signal for days ahead. Nifty 5500 put open interest standing highest no at 8921050 contracts, so expect that 5500 level is not going to break any how in Nov series.
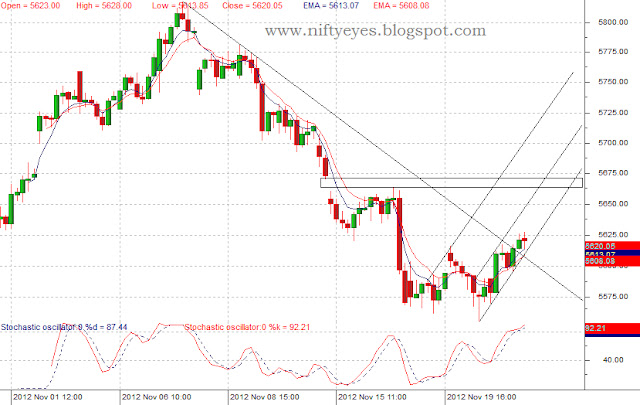
As per Nifty EOD chart bullish green candle stick pattern has formed with rising RSI and slow stochastic indicators giving bullish signal for days ahead. Current support for swing and very short term and intraday traders will be at 5601. Now nifty has turned into buy on dips formula for short term traders, I repeat buy on dips for short term traders. for long term investors nifty is in sell on rise mode.
Good luck.
20 November 2012
WONDERFUL OPPORTUNITY WAITING IN M&M

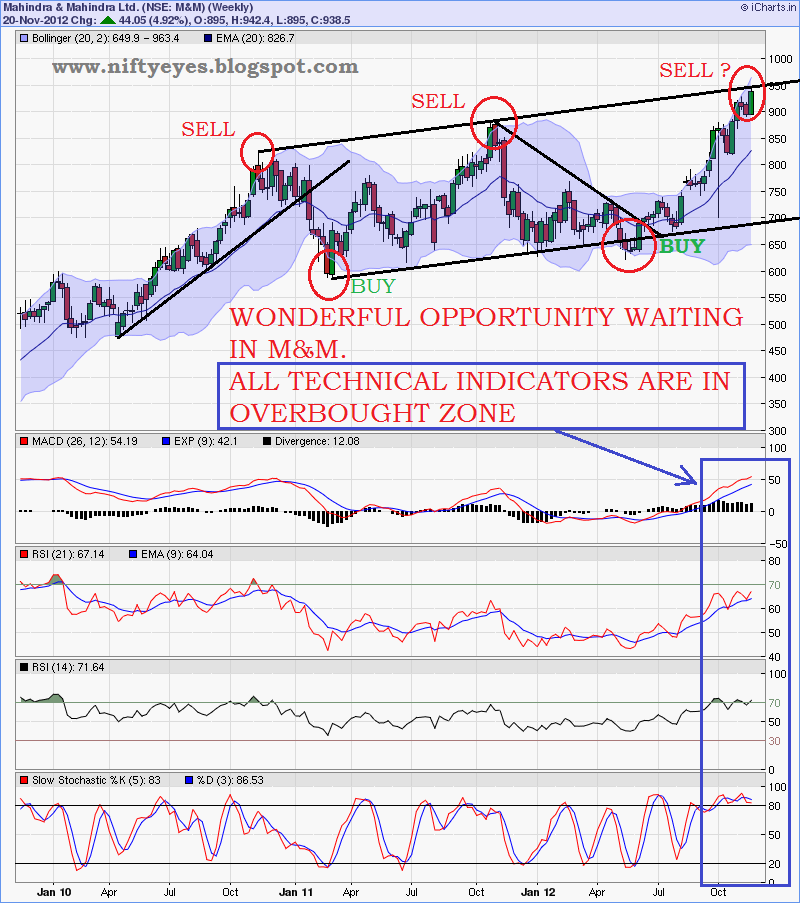
THERE ARE WONDERFUL OPPORTUNITY WAITING IN M&M. AS PER ABOVE CHART THE STOCK HAS ZOOM TO 3.27% TODAY AND 4.9% IN TWO DAYS AND TOUCHED LONG TERM WEEKLY CHANNEL. ALL TECHNICAL INDICATORS ARE PLACED IN OVERSOLD ZONE ON BOTH DAILY AND WEEKLY CHARTS.
WILL THIS STOCK BREAK UPPER CHANNEL LINE OR IT WILL REVERS FROM THERE LIKE EARLIER. ANYONE CAN TAKE RISK HERE.
SHORT M&M IN FUTURE SEGMENT OF DEC SERIES AROUND 945-948 SPOT PRICE WITH STOPLOSS AT 955 ON CLOSING BASIS. IF STOPLOSS HIT REVERSE YOUR TRADE ON THE LONG SIDE FOR THE TARGET OF 975 AND STOPLOSS WOULD BE AT 944 FOR LONG TRADE.
GOOD STRATEGY TRADE NEGATIVE IF FAILS TO CROSS 945-948 STOPLOSS 955.
TRADE POSITIVE IF SUSTAIN ABOVE 945-948 STOPLOSS WOULD BE AT LOW.
SHORT THIS STOCK
NIFTY X-RAY REPORT FOR 21 NOV
Have you all noted the today's low of Nifty future 5555.55. Is this any magical no.
Fii were the net buyer today in all segment after 15 days.
INDEX
FUTURES - 275.90
INDEX OPTIONS -226.91
STOCK FUTURES- 270.80
STOCK OPTIONS -23.49
Future volume was high in todays session. As we discussed in earlier post that nifty may take support around 5550. It made low at 5548 and reversed back from there and closed in little red. As you see in below hourly chart that nifty has formed double bottom formation and RSI is giving positive divergence signal. Nifty daily chart is also forming double bottom formation. There is two clear trendline resistence on hourly chart. Nifty in tomorrow session if trade above 5593 then it may zoom to 5625 and sustaining above this level fresh express rally will start. But as global indices blasted yesterday our Indian market was not perform well along with that, but we can expect a bounce from here. The bounce expectation is not emotional but technical.
trend line support
double bottom support
double bottom on hourly chart.
slow stochastic oversold
rsi oversold
Throughout buying by Fii
All are indicating that need to be cautious for short side.
5593 and 5625 are two level important level which will give impact on Nifty tomorrow.
5950 coming soon.
my dear all viewer how do you like my NIFTY X-RAY REPORT must write comment to my email id. It will really help me to improve my reports/research and other services.
Regard

19 November 2012
NIFTY X- RAY REPORT FOR 20 NOV
WE HAVE SEEN NIFTY TOUCHED THE LOWER TREND LINE TODAY WHICH IS AROUND 5550. BELOW THIS TREND LINE AS YOU ARE SEEING THAT THERE IS A GAP ON CHART. ANY CLOSE BELOW 5525 NIFTY MAY TEST LOWER LINE OF GAP. BUT WHEN YOU CONSIDER THE WHOLE CHART YOU WILL FIND THAT THERE IS A ANOTHER BIG LONG TERM TREND LINE WHICH COMES AROUND 5200.

WILL NIFTY FALL TO 5200 OR NIFTY WILL GO TOWARDS 6000. IT WILL CONFIRM THE BLUE TREND LINE IN BELOW CHART. PRICE WISE WE NEED CONFIRMATION, IF NIFTY GIVE A CLOSE ABOVE 5630 THEN IT WOULD BE FIRST CONFIRMATION. AS WE ARE SEEING THAT SOME POSITIVE MOVE IN U.S MARKET MAY HELP NIFTY TO OPEN SOME GAP UP AROUND 5630 AREA AND NIFTY BOUNCE MAY START FROM HERE.
TECHNICAL REMAIN AS SAME AS YESTERDAY. NIFTY IS TRENDING DOWN SINCE 6 DAYS.
FIIS PARTICIPATION WAS CALM IN MARKET TODAY. NOT TO MUCH ACTION SEEN IN FNO AND CASH SEGMENT. HIGHEST OPEN INTEREST POSITION IN 5500 PUT ARE READY TO GIVE SUPPORT NIFTY. DAY BEFORE YESTERDAY FII BOUGHT OPTIONS WORTH RS 1488 CORES. WERE THE OPTION BOUGHT ON CALL SIDE WILL BE CONFIRM IF NIFTY SUSTAIN ABOVE 5630.

NIFTY 5950 COMING SOON.

18 November 2012
AURBINDO PHARMA
 AURBIDO PHARMA HEADING TOWARDS 212. BUY THIS STOCKS ABOVE 178.45 ANY TWO CLOSE ABOVE THIS LEVEL STOCK WILL ZOOM TO 212 LEVEL VERY SOON IN FEW WEEKS. THE STOCK HAS CLOSED NEAR ITS 50% RETRACEMENT LEVEL. ANY CLOSE ABOVE THIS LEVEL WILL ZOOM TO 61.8% LEVEL. THE STOCK HAS ADDED 8.43% FRESH OPEN INTEREST IN FUTURE SEGMENT WHICH IS INDICATING FRESH LONG POSITION HAS BEEN TAKEN IN THIS STOCK. STOPLOSS WILL BE BELOW170.

NIFTY X-RAY REPORT FOR 19 NOV
Nifty has moved below its 50 day moving averages after 45 days in last session and closed at 5574. Just two week before it was making 52 week high and in just two week it is trading at 2 months low level. Nifty is trending down since five days, in other words nifty is daily closing at a lower price than its previous days close. As per slow stochastic on nifty daily chart, it has placed in oversold zone and stochastic may reverse upside any time.
As you are seeing in the chart below that nifty is near its long term trend line support around 5545. If this trend line work for nifty in coming session then we may see a 5th wave up move till 5950-5600. Still I think that a rally till 5950 is due in our market, otherwise i will have to give a another alternative count.
Fii sold 27543 contracts worth rs 725 cores and open interest decreased by 11%. As nifty future was down by 68 points and open interest decreased by 11% indicating that long has been covered.
But I don't see any panic like situation in current market even though all U.S and European market is in frequently down trend. Fiis bought 509 cores in cash market segment. Nifty 5500 put is standing with highest open interest at 70,70,300 contracts indicating that 5500 level will give support nifty in next session and 5500 call added fresh 15,10,850 contracts in open interest. Fiis bought index option worth rs 1400 cores and addition in open interest 5500 call seems that fiis have bought option (5500 CE) in dip.
Nifty is at crucial juncture and trend line will decide the trend of nifty. If holds next wave may take nifty upto 5959-6000.
GOOD LUCK

HOW DO YOU CHOOSE A BROKER
Investing in the stock market requires the assistance of a stockbroker to execute your orders even if you don’t feel like you need their advice.
Finding the right stockbroker will make your trading experience more efficient and profitable. There are several different types of brokers and financial advisers that will work with you.
All brokers will execute trades for their clients, but a good broker will also research on various investments in stock market and provide advice to you. A good broker really consider your portfolio. Ideally, a good broker thoroughly researches various investments and keeps you up-to-date with market trends and with the stock performance. Did you consider this ever before signing the application form.
In return for these services, the broker charges fees when you buy or sell stocks. For example, you buy 100 quantity stocks and you pay brokerage rs 100. A broker also typically charge annual service charges or maintenance fees for your account. Most disturbing, because all brokers receive commissions every time for executing a trade for the client, their compensation is largely determined by how many times you buy and sell stocks in your account. This is not to say that you shouldn't use a broker, but if you do, go into it with your eyes wide open, thoroughly check the broker out. Does your broker charging very high commission for executing trade. For example, if you buy 100 quantity of a perticular stocks which price is at 100 and the broker charge rs 100 for executing order. Same order can be execute at rs 20-30 only. which broker would you like to choose. choice is yours. Does your broker provide you technical analysis training and various research on stocks and on stock Market, because they are charging annuals fees and commissions on your every buy and sells. If not then you are only the source of profit for them, but they are not for you.
Nifty Eyes provide all technical training for their clients absolutly free and charges very low brokerages. yes we charge Rs 20 only per trade order, quantity no matter.
Open an account with Us and learn free tecnical analysis training and get various research on market and stocks. We are associate partner with Zerodha! Zerodha is an online discount brokerage firm. Through us you can buy and sell Stocks, Futures & Options, Commodities, and Currencies using cutting-edge software at unbelievably low costs. Zerodha charges a fee of only 0.01% or a maximum Rs. 20 per executed order irrespective of the size of the order.
We have made things really simple for you. To start off, you can check out our brokerage calculator on the right side of home page of this website and view the savings you can make by trading with us. Once you've seen what you need to see, you can go right ahead and decide what kind of account and broker works best for you choice is yours.
good luck
contact for open an account- eyesnifty@gmail.com
Subscribe to:
Posts (Atom)